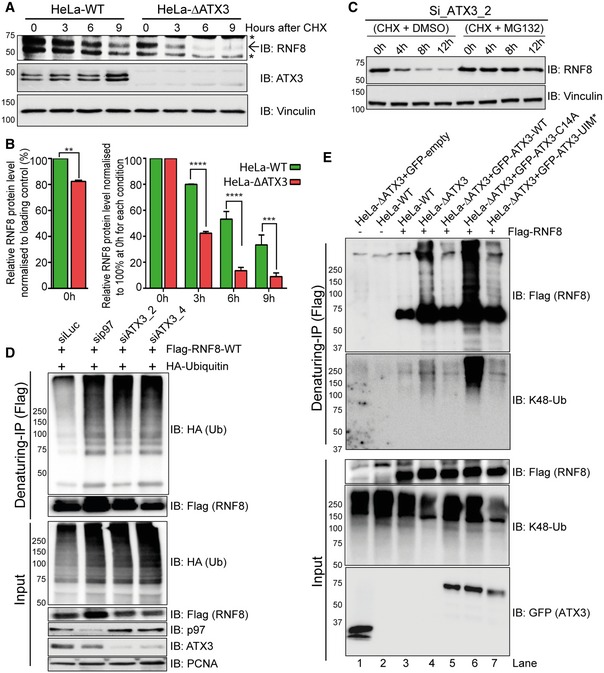
Figure 4. ATX3 deubiquitinates RNF8.

- Western blot analysis of CHX chase kinetics in HeLa cells showing accelerated endogenous RNF8 degradation in the soluble fraction (cytosol and nucleosol) of ∆ATX3 cell extract. Arrow represents the main RNF8 band, and asterisks represent unspecific bands.
- Graphs represent the quantifications of (A). RNF8 level at starting point (0 h) was shown without equalisation (left). In order to nullify the difference in RNF8 level at starting point (0 h), we equalised RNF8 level to 100% and then compared the degradation rate (right) (**P < 0.01, ***P < 0.001, ****P < 0.0001; two‐way ANOVA, n = 2, mean + SEM).
- Western blot analysis of CHX chase showing the kinetics of endogenous RNF8 degradation in the soluble fraction (cytosol and nucleosol) of ATX3‐knockdown HeLa cells. The degradation was completely blocked after simultaneous inhibition of proteasome (MG132, 10 μM).
- Western blot analysis of Flag‐RNF8 denaturing‐IP in HEK293 cells showing RNF8 hyper‐ubiquitination in siRNA‐mediated p97 or ATX3‐depleted conditions.
- Western blot analysis of Flag‐RNF8 denaturing‐IP in HeLa cells showing RNF8 hyper‐ubiquitination in ∆ATX3 condition. RNF8 hyper‐ubiquitination was suppressed by reintroduction of GFP‐ATX3‐WT but not with GFP‐ATX3‐C14A or GFP‐ATX3‐UIM*.
Source data are available online for this figure.
