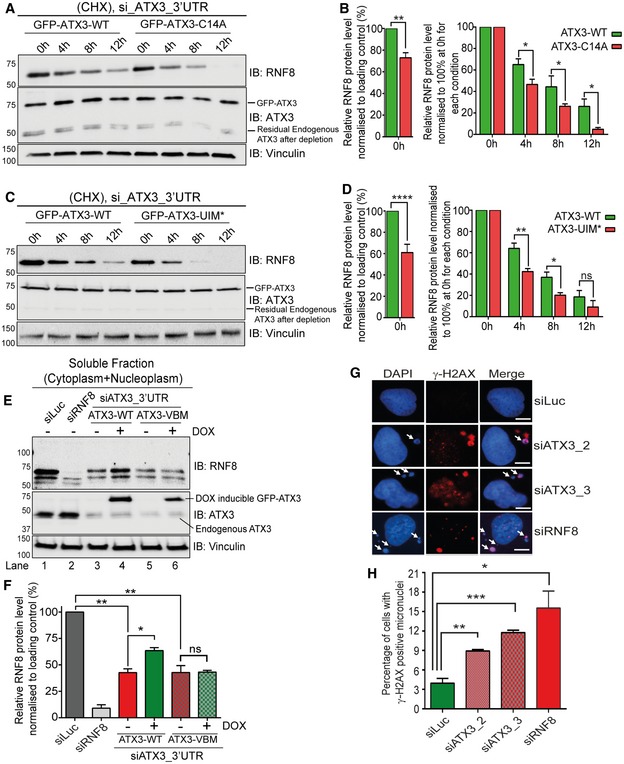
Figure 5. ATX3 protects RNF8 from premature degradation.

- Western blot analysis of CHX chase showing accelerated degradation of RNF8 in soluble fraction (cytoplasm + nucleoplasm) of HeLa cells, expressing DOX‐inducible GFP‐ATX3‐C14A variant as compared to GFP‐ATX3‐WT. Endogenous ATX3 was depleted with siRNA targeting 3′UTR region of ATXN3.
- Graph represents the quantifications of (A). In order to nullify the difference in RNF8 level at starting point (0 h), we equalised RNF8 level to 100% and then compared the degradation rate. RNF8 level at starting point (0 h) was also shown without equalisation (*P < 0.05, **P < 0.01; two‐way ANOVA, n = 2, mean + SEM).
- Western blot analysis of CHX chase showing accelerated degradation of RNF8 in soluble fraction (cytoplasm + nucleoplasm) of HeLa cells, expressing DOX‐inducible ATX3‐UIM* variant as compared to ATX3‐WT. Endogenous ATX3 was depleted with siRNA ATX3_3′UTR.
- Graph represents the quantifications of (C). In order to nullify the difference in RNF8 level at starting point (0 h), we equalised RNF8 level to 100% and then compared the degradation rate. RNF8 level at starting point (0 h) was also shown without equalisation (ns P > 0.05, *P < 0.05, **P < 0.01, ****P < 0.0001; two‐way ANOVA, n = 2, mean + SEM).
- Western blot analysis showing endogenous RNF8 protein level in soluble fraction (cytosol and nucleosol) of HeLa cells under indicated conditions. RNF8 level was significantly reduced after siRNA‐mediated ATX3 depletion and then was significantly rescued by DOX‐inducible expression of GFP‐ATX3‐WT but not with GFP‐ATX3‐VBM.
- Graphs represent the quantifications of (E) (ns P > 0.05, *P < 0.05, **P < 0.01; unpaired t‐test, n = 3, mean + SEM).
- Representative IF images showing γ‐H2AX‐positive micronuclei (white arrows) under physiological conditions with indicated siRNA‐mediated depletion. Scale bar: 10 μm.
- Graph represents quantification of (G), showing percentage of cells with γ‐H2AX‐positive micronuclei in U2OS cells (*P < 0.05, **P < 0.01, ***P < 0.001; unpaired t‐test, n = 3, mean + SEM, at least 200 randomly selected nuclei were counted per condition per experiment).
Source data are available online for this figure.
