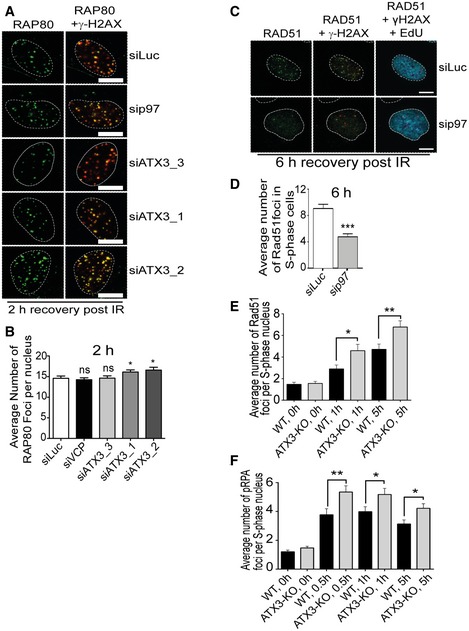
Representative IF micrographs of U2OS cells showing IR‐induced foci for endogenous RAP80 and γ‐H2AX under indicated siRNA‐depleted conditions 2 h after IR (2 Gy) treatment. Scale bar: 10 μm.
Quantification of (A). Graph represents the average number of RAP80 foci per nucleus (ns
P > 0.05, *P < 0.05; unpaired t‐test, n = 2, mean + SEM, at least 100 nuclei per condition and experiment).
Representative IF micrographs in U2OS cells showing IRIF for endogenous RAD51 and γ‐H2AX under indicated siRNA‐depleted conditions 6 h after IR (2 Gy) treatment. EdU staining was used to label S‐phase cells. Scale bar: 10 μm.
Quantification of (C). Graph represents the average number of RAD51 foci per EdU‐positive nucleus (***P < 0.001; unpaired t‐test, n = 2, mean + SEM, at least 100 nuclei per condition and experiment).
Graph representing average number of Rad51 foci per S‐phase (EdU‐positive) nucleus in U2OS∆ATX3 cells as compared with control at different time points (0, 1 and 5 h) after 2 Gy of IR treatment (*P < 0.05, **P < 0.01; unpaired t‐test, n = 3, mean + SEM, at least 100 nuclei were counted per condition and experiment).
Graph representing average number of pRPA foci per S‐phase (EdU‐positive) nucleus in U2OS∆ATX3 cells as compared with control at different time points (0, 0.5, 1 and 5 h) after 2 Gy of IR treatment (*P < 0.05, **P < 0.01; unpaired t‐test, n = 3, mean + SEM, at least 100 nuclei were counted per condition and experiment).

