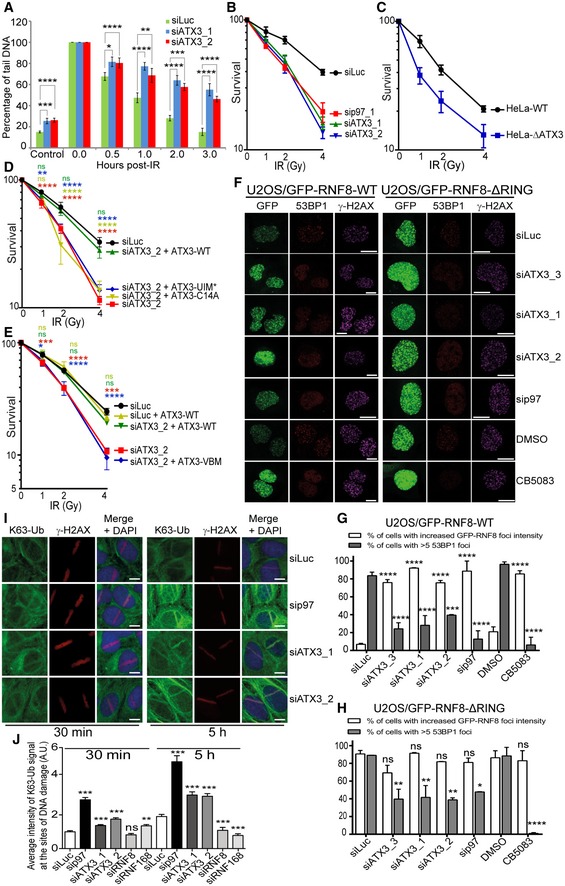
Quantifications of neutral comet assay showing the level of DSBs under indicated siRNA‐depleted conditions, before and after IR (4 Gy) (*P < 0.05, **P < 0.01, ***P < 0.001, ****P < 0.0001; two‐way ANOVA, n = 3, mean + SEM).
Colony formation assay (CFA) showing the IR sensitivity of HeLa cells under siRNA‐mediated p97 or ATX3‐depleted conditions (n = 3, mean ± SD).
CFA showing the IR sensitivity of HeLa‐WT cells compared to HeLa∆ATX3 cells (n = 3, mean ± SD).
CFA showing the rescue of cell survival in IR‐treated, ATX3‐depleted (siRNA), HeLa cells, after DOX‐inducible expression of ATX3‐WT but not with ATX3‐C14A or ATX3‐UIM* variant (ns
P > 0.05, **P < 0.01, ****P < 0.0001; two‐way ANOVA, n = 3, mean ± SD).
CFA showing the rescue of cell survival in IR‐treated, ATX3‐depleted (siRNA), HeLa cells, after DOX‐inducible expression of ATX3‐WT but not with ATX3‐VBM variant (ns
P > 0.05, *P < 0.05, ***P < 0.001, ****P < 0.0001; two‐way ANOVA, n = 3, mean ± SD).
Representative IF micrographs in U2OS cells showing IRIF formation of GFP‐RNF8‐WT, 53BP1 and γ‐H2AX (first panel) and GFP‐RNF8‐∆RING, 53BP1 and γ‐H2AX (second panel) under indicated siRNA‐depleted or p97‐inhibited (CB5083) conditions. Scale bar: 10 μm.
Quantification of (F) for GFP‐RNF8‐WT. Graph represents the percentage of cells with increased GFP‐RNF8‐WT foci (white bars) or percentage of cells with > 5 53BP1 foci (grey bars) (***P < 0.001, ****P < 0.0001; two‐way ANOVA, n = 2, mean + SEM, at least 100 nuclei per condition and experiment).
Quantification of (F) for GFP‐RNF8‐∆RING. Graph represents the percentage of cells with increased GFP‐RNF8‐∆RING foci (white bars) or percentage of cells with > 5 53BP1 foci (grey bars) (ns
P > 0.05, *P < 0.01, **P < 0.01, ****P < 0.0001; two‐way ANOVA, n = 2, mean + SEM, at least 100 nuclei per condition and experiment).
Representative IF images and quantification showing endogenous K63‐Ub and γ‐H2AX at UV‐A micro‐laser‐induced DNA damage tracks in U2OS cells under indicated siRNA‐depleted conditions. Scale bar: 10 μm.
Quantification of (I). Graph represents the average intensity of the K63‐Ub (ns
P > 0.05, **P < 0.01, ***P < 0.001; unpaired t‐test, n = 2, mean + SEM, more than 50 nuclei were analysed).

