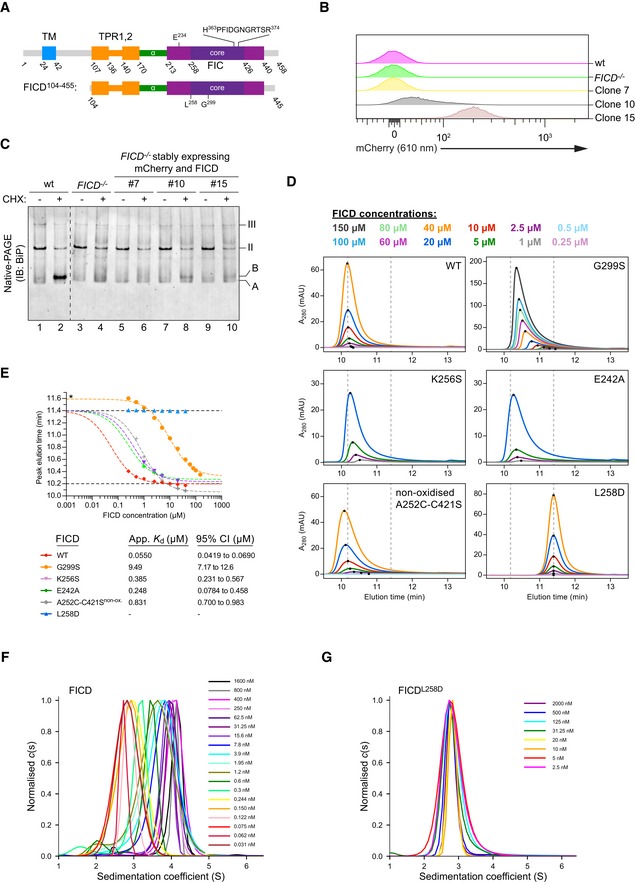
Figure EV1. Low‐level expression facilitates AMPylation in vivo and FICD mutations are able to disrupt the tight dimer formed in solution.

-
ASchematic representation of the domain organisation of FICD and the shorter protein fragment used for in vitro experiments. The transmembrane domain (blue), the TPR domain (orange), the α‐helical linker (green), the Fic domain (purple) and the core Fic domain (deep purple) including the active site motif are indicated.
-
B, CCharacterisation of CHO‐K1 FICD −/− UPR reporter clones stably expressing wild‐type (wt) FICD. (B) Flow cytometry analysis of CHO‐K1 FICD −/− UPR reporter clones stably expressing mCherry and FICD. Clones were selected based on mCherry signal, assuming a direct correlation with FICD expression levels. (C) Immunoblot of endogenous BiP from CHO‐K1 FICD −/− clones shown in (B) exposed to cycloheximide as in Fig 1A. Note that only clone 10, with an intermediate mCherry signal, showed detectable accumulation of AMPylated BiP.
-
D, ESize‐exclusion chromatography (SEC) analysis of wild‐type and mutant FICD proteins. (D) SEC elution profiles with FICD proteins at the indicated concentrations. Black dots mark the position of the elution peaks. Dotted lines mark the approximate elution peak times for dimeric (10.2 min) and monomeric (11.4 min) FICD, respectively. Absorbance at 280 nm (A280 nm) is plotted in units of milli‐absorbance units (mAU). (E) Plot of the elution peak times from (D) as a function of protein concentration. With the exception of FICDG299S (*a mutation that shifts the elution time relative to the monomer), best‐fit monomer‐dimer association curves are shown with the top plateau constrained to the monomer elution time (11.4 min). Approximate dimerisation K ds were derived and are shown in the figure key for the different partially monomerising mutants (with 95% confidence intervals). Note that FICDL258D eluted as a monomer and wild‐type FICD principally as a dimer at all concentrations tested (0.2–50 µM). Conversely, FICDG299S and non‐oxidised FICDA252C‐C421S formed much weaker dimers. As in (D), the monomer and dimer elution times are represented by dotted (horizontal) lines.
-
F, GAnalysis of FICD by analytical ultracentrifugation. Overlays of c(s) distributions of (F) wild‐type FICD and (G) FICDL258D are shown in units of experimental s‐values. A signal‐weighted isotherm for the wild‐type protein (Fig 1E) was generated from integration of the titration series distributions.
