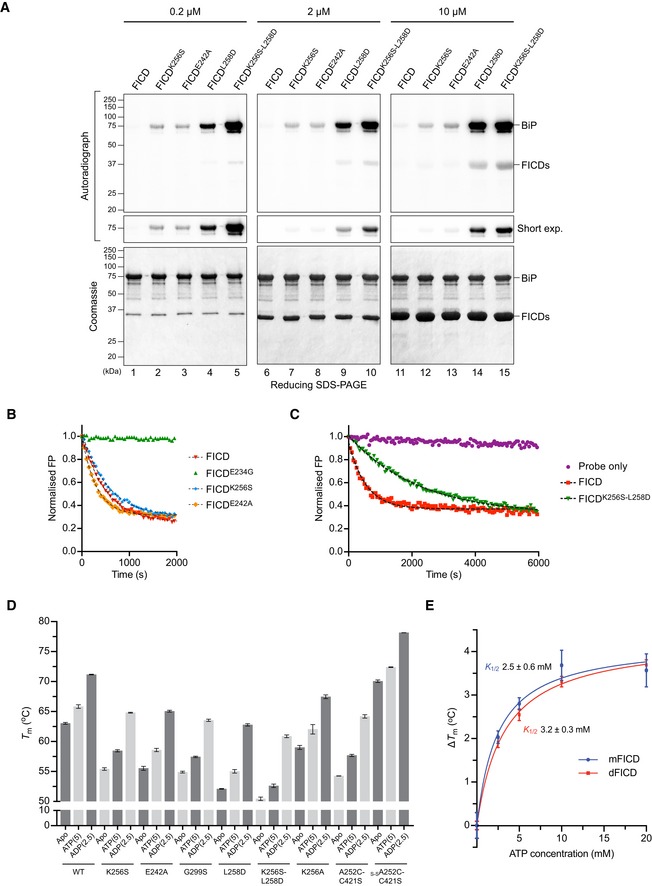
Figure EV3. FICD dimer relay mutants produce a pool of AMPylated BiP in vitro, and FICD AMPylation activity correlates with increased flexibility.

-
ARadioactive in vitro AMPylation reactions with the indicated FICD proteins at the indicated concentrations, [α‐32P]‐ATP, and BiPT229A‐V461F were analysed by SDS–PAGE. The radioactive signals were detected by autoradiography and proteins were visualised by Coomassie staining. Note the enhanced production of AMPylated BiP in the presence of dimer relay mutants, FICDK256S and FICDE242A, relative to the wild‐type protein and a further increase in the production of AMPylated BiP by the monomeric FICDK256S‐L258D double mutant relative to monomeric FICDL258D. Also note the auto‐AMPylation signals of the monomeric FICDs detectable at high enzyme concentration.
-
B, CIn vitro deAMPylation of fluorescent BiPV461F‐AMPFAM by the indicated FICD proteins (at 7.5 µM) measured by fluorescence polarisation. A representative experiment (data points and fit curves) is shown and rates are presented in Fig EV2A. Note the impaired deAMPylation activity of the monomeric FICDK256S‐L258D double mutant in (C).
-
DDSF T m analysis of wild‐type (wt) and mutant FICD proteins in absence (Apo) or presence of ATP or ADP. Nucleotide concentrations in mM are given in parentheses. Non‐oxidised and oxidised forms of FICDA252C‐C421S were assayed in buffer lacking reducing agent (which did not affect the T m of wild‐type FICD; see source data). Shown are the mean T m values ± SD from three independent experiments. Note that FICDK256A is more stable than FICDK256S but less than wild‐type FICD. Furthermore, the stabilities of oxidised and non‐oxidised FICDC421S‐A252C relative to the wild‐type correlate inversely with their AMPylation activities (Fig 3B). For the wild‐type FICD, FICDE242A, FICDG299S, FICDL258D and FICDK256S‐L258D, in the apo state, the same data are presented in Fig 4E.
-
EPlot of the increase in FICD melting temperature (∆T m) against ATP concentration as measured by DSF (derived from Fig 4F). Note the similarity in the K 1/2s of ATP‐induced T m increase (annotated) between FICDL258D (mFICD) and the wild‐type dimer (dFICD). Shown are mean ∆T m values ± SD of three independent experiments with the best‐fit lines for a one‐site binding model.
Source data are available online for this figure.
