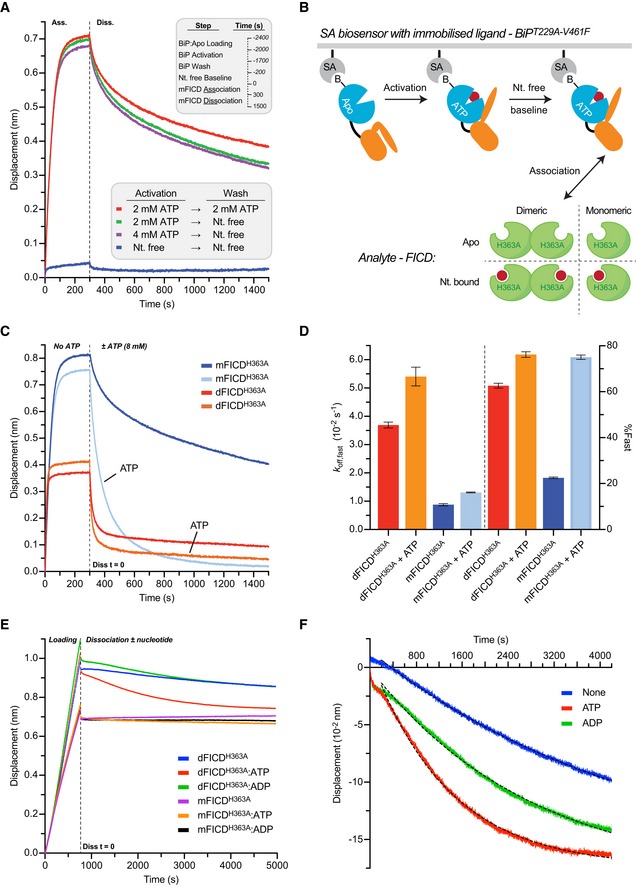
Figure EV6. ATP negatively modulates pre‐AMPylation complex and FICD dimer stability.

- Immobilised BiP responds allosterically to, is saturated by and retains ATP for the duration of BLI kinetic assays. BLI traces of the interaction between FICDL258D‐H363A and immobilised biotinylated BiPT229A‐V461F in different nucleotide states. Before exposure to FICDL258D‐H363A immobilised BiP:Apo was subjected to two consecutive incubation steps (activation and wash) in the presence or absence of ATP as indicated. FICD association and dissociation steps (shown) were then conducted in a nucleotide (Nt.)‐free solution. Note that BiP only interacts with FICDL258D‐H363A when pre‐saturated with ATP. Importantly, ATP pre‐bound BiP retains its affinity for FICDL258D‐H363A even if subsequently washed in a buffer lacking ATP (compare red and green traces). Thus, the majority of BiP retains its bound ATP for the duration of the kinetic experiment, experimentally uncoupling the effect of nucleotide on the FICD analyte from its effect on the immobilised BiP ligand.
- Cartoon schematic of the BLI assays presented in Fig 6A and B. The pre‐AMPylation complex is formed between the immobilised BiP:ATP “ligand” and the FICD “analyte”.
- The BLI association and dissociation traces from Fig 6B are shown. The immobilised biotinylated BiPT229A‐V461F was saturated with ATP and then exposed to nucleotide‐free FICDs. Dissociation was performed in absence or presence of ATP, as indicated. [mFICDH363A: FICDL258D‐H363A; dFICDH363A: FICDH363A].
- Quantification of the biphasic exponential decay fitting of dissociation traces shown in Fig 6B. Relative ATP‐induced changes of these kinetic parameters are given in Fig 6D. Shown are mean values ± SD from three independent experiments. Note the greater relative contribution of fast dissociation of mFICD in presence of ATP versus absence.
- Representative BLI traces of an FICD dimer dissociation experiment. The legend indicates the form of unlabelled FICD incubated with the N‐terminally biotinylated FICD (at a 100‐fold molar excess, prior to biosensor loading) and also the ligand present in the dissociation buffer (at 5 mM) if applicable.
- Representative dissociation data derived from (E). Probes loaded with biotinylated FICD incubated with mFICDH363A act as controls for non‐specific association and dissociation signals, these were subtracted from the respective dFICDH363A traces in (E). Mono‐exponential decay best‐fit lines are also displayed; resulting off rates are shown in Fig 6E(ii).
