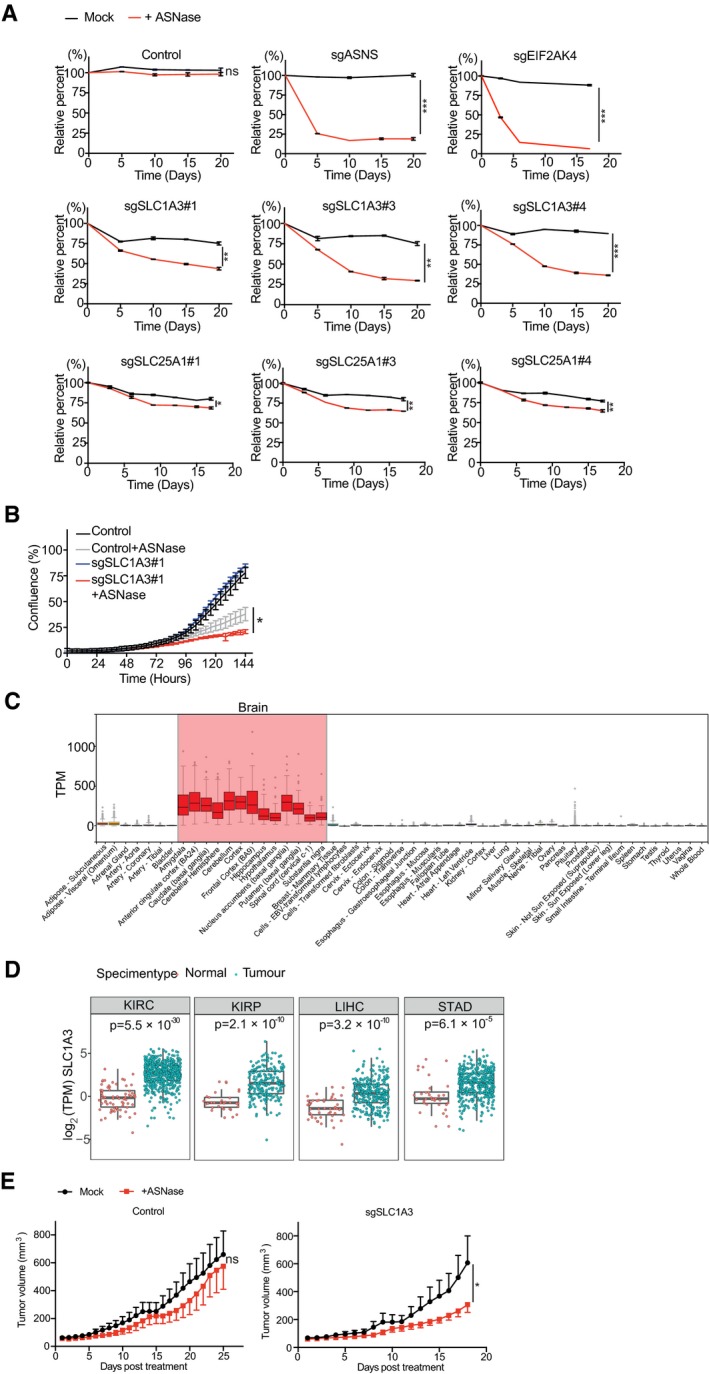
Figure EV1. Validation of hits from the genome‐wide CRISPR‐Cas9 screen in PC3 cells.

- PC3 cells were transduced with individual sgRNA lentiviral vectors as indicated and subjected to competitive cell proliferation assays under mock or ASNase (0.3 U/ml) conditions. #1, #3, and #4 represent different sgRNAs and n = 2 for each condition.
- PC3 cells were transduced with control (sgNon‐targeting) or sgSLC1A3 and subjected to IncuCyte cell proliferation assays with or without ASNase (0.3 U/ml). #1 indicates a sgRNA targeting SLC1A3 and n = 3 for each condition.
- SLC1A3 expression analysis in normal tissues from GTEX portal (gtexportal.org/home/gene/SLC1A3). Red columns indicate high SLC1A3 expression in most brain tissues. Expression values are shown in TPM (transcripts Per Million), calculated from a gene model with isoforms collapsed to a single gene. No other normalization steps have been applied. Box plots are shown as median and 25th and 75th percentiles; points are displayed as outliers if they are above or below 1.5 times the interquartile range.
- TCGA tumor database analysis of SLC1A3 expression in healthy tissues and primary tumors for kidney renal clear cell carcinoma (KIRC), kidney renal papillary cell carcinoma (KIRP), liver hepatocellular carcinoma (LIHC), and stomach adenocarcinoma (STAD). Expression data from tumor and normal tissue samples were downloaded for every project available at ICGC data portal (http://dcc.icgc.org; release 27). For consistency, only expression data from pipeline “RNASeqV2_RSEM_genes” were considered. The downloaded normalized expression data were scaled to TPM (transcripts per million reads) and log2 transformed. Only projects with more than 10 normal samples were considered (each dot represents one sample). All analyses were done using R‐language. The statistical comparison between normal and tumor samples was done using a non‐parametric Wilcoxon sum rank test followed by Bonferroni correction. Box plots are shown as median and 25th and 75th percentiles; points are displayed as outliers if they are above or below 1.5 times the interquartile range.
- Control (sgNon‐targeting#1) and SLC1A3 knockout (sgSLC1A3#4‐1) PC3 cell lines were subcutaneously injected into Balb/c nude mice (cAnN/Rj; n = 8 per group). Once tumor volumes reached 50 mm3, mice were treated with mock (saline) or ASNase (60 U per day). Data were presented as mean ± SEM.
