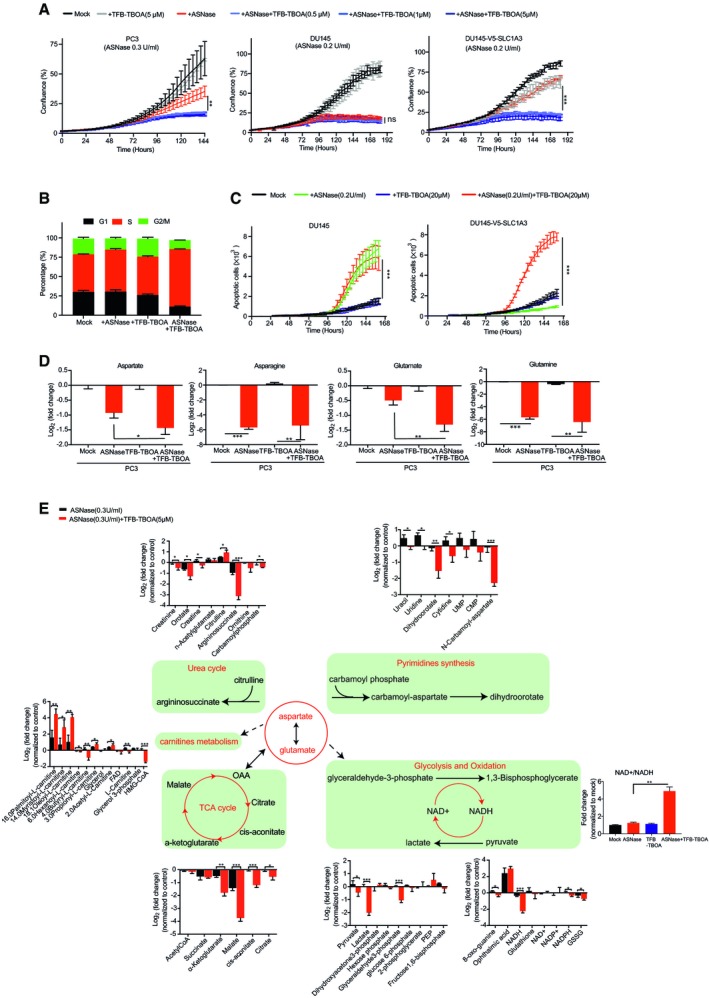
PC3, DU145, and V5‐SLC1A3‐DU145 cells were subjected to ASNase and TFB‐TBOA treatment at indicated concentrations, and cell proliferation was measured by IncuCyte assay.
PC3 cells were treated under indicated conditions for 9 days and subjected to BrdU assays to determine cell cycle distributions. ASNase (0.3 U/ml), TFB‐TBOA (5 μM).
DU145 and V5‐SLC1A3‐DU145 cells were treated under indicated conditions with ASNase (0.2 U/ml) or TFB‐TBOA (20 μM) or both, and subjected to IncuCyte analysis for apoptotic cell counts.
PC3 cells were treated under ASNase (0.3 U/ml), or TFB‐TBOA (5 μM) conditions for 3 days and cell lysates were extracted and intracellular contents of aspartate, asparagine, glutamate, and glutamine were determined by liquid‐chromatography mass spectrometry (LC‐MS).
From the same experiment as in panel (D), key metabolites involved in urea cycle, pyrimidine synthesis, TCA cycle, oxidation, glycolysis, and carnitines metabolism were determined. The NAD+/NADH ratio of the indicated conditions was calculated and normalized to control (mean ± SEM). Dash line indicates indirect effect. TCA cycle, tricarboxylic acid cycle; OAA, oxaloacetic acid; UMP, uridine monophosphate; CMP, cytidine monophosphate; PEP, phosphoenolpyruvate; NADH, nicotinamide adenine dinucleotide (reduced form); NAD+, nicotinamide adenine dinucleotide (oxidized form); NADPH, nicotinamide adenine dinucleotide phosphate (reduced form); NADP+, nicotinamide adenine dinucleotide phosphate (oxidized form); FAD, flavin adenine dinucleotide; GSSG, glutathione disulfide; HMG‐CoA, 3‐hydroxy‐3‐methylglutaryl‐CoA.
Data information: Median peak intensity was used for raw data normalization in (D and E). Results were calculated based on three replicates and presented as mean ± SD (unless otherwise stated). The
‐test from Prism7. *
0.001.

