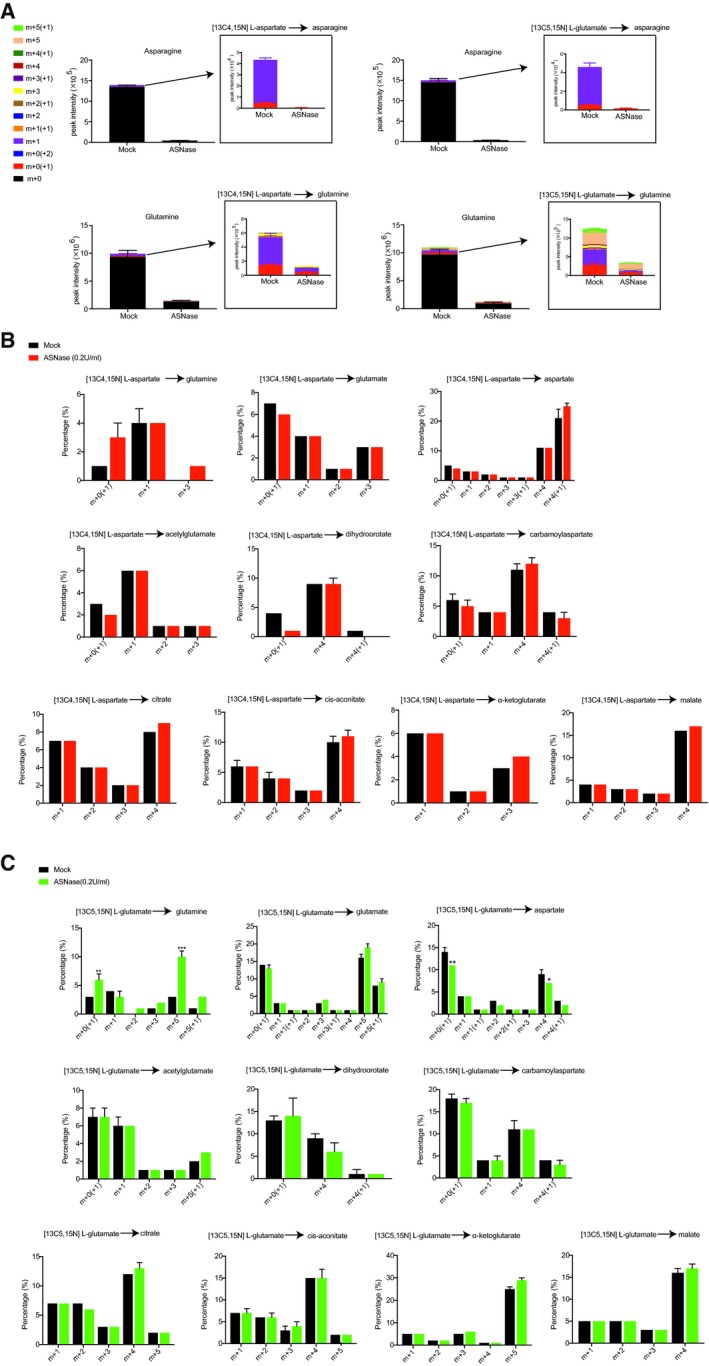
DU145‐V5‐SLC1A3 cells were pretreated with ASNase (0.2 U/ml) for 48 h and then supplemented with [
13C
4,
15N] L‐aspartate (1.5 mM) and unlabeled glutamate (1.5 mM), or [
13C
5,
15N] L‐glutamate (1.5 mM) and unlabeled aspartate (1.5 mM) for 8 h. Subsequently, cells were harvested for LC‐MS analysis.
Mass isotopologue analysis of 13C and 15N incorporation into asparagine and glutamine in DU145‐V5‐SLC1A3 cells cultured as indicated conditions.
Mass isotopologue analysis of 13C and 15N incorporation into glutamine, glutamate, and aspartate and metabolites from TCA cycle, urea cycle, and nucleotide synthesis in DU145‐V5‐SLC1A3 cells cultured with [13C4,15N] L‐aspartate and unlabeled glutamate.
Mass isotopologue analysis of 13C and 15N incorporation into glutamine, glutamate, and aspartate and metabolites from TCA cycle, urea cycle, and nucleotide synthesis in DU145‐V5‐SLC1A3 cells cultured with [13C5,15N] L‐glutamate and unlabeled aspartate.
Data information: Data shown in (B–C) were calculated as labeled fraction divided by total peak area (including unlabeled fraction), and results were presented as mean ± SD (
n = 3). Number before brackets accounts for
13C incorporation and number in brackets accounts for
15N incorporation. The
P‐value was calculated by two‐tailed unpaired
t‐test from Prism7. *
P <
0.05, **
P <
0.01, ***
P <
0.001.

