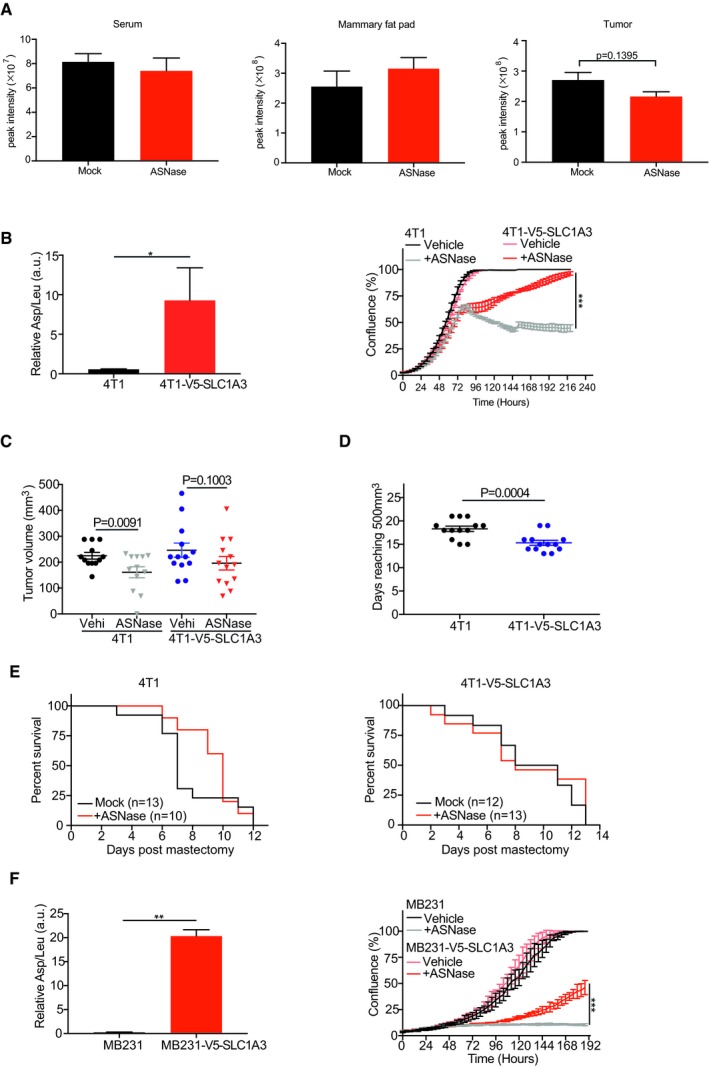
Glutamine levels in serum, mammary fat pad tissues, and growing tumors derived from SUM159PT human breast cancer cells with or without ASNase treatment (60 U per day) for consecutive 5 days. Essential amino acids were used for the raw data normalization. Results were presented as mean ± SEM (n = 3).
Left: quantification of aspartate uptake in parental 4T1 and 4T1‐V5‐SLC1A3 cells (n = 2). Leucine uptake was used for normalization. The P‐value was calculated by one‐tailed unpaired t‐test in Prism7. Right: IncuCyte cell proliferation curves for parental 4T1 and 4T1‐V5‐SLC1A3 cells with or without ASNase (0.2 U/ml) for 10 days (n = 3).
Tumor volumes resulting from orthotopic implantation of parental 4T1 and 4T1‐V5‐SLC1A3 cells at day 12 (n = 13 mice per group, except for 4T1 + ASNase, n = 12). Results were presented as mean ± SEM.
Days for orthotopically injected parental 4T1 and 4T1‐V5‐SLC1A3 cells to reach 450–550 mm3. Results were presented as mean ± SEM (n = 13).
Following the mastectomy, mice were daily challenged for breathing test and sacrificed due to breathing problems. The survival rate for 4T1‐ and 4T1‐V5‐SLC1A3‐injected mice was scored in Prism7.
Left: quantification of aspartate uptake in MDA‐MB‐231 and MDA‐MB‐231‐V5‐SLC1A3 cells (n = 2). Leucine uptake was used for normalization. Right: IncuCyte cell proliferation measurements for MDA‐MB‐231 and MDA‐MB‐231‐V5‐SLC1A3 cells with or without ASNase (1 U/ml) for 8 days (n = 3).
Data information: Results were calculated based on three replicates and presented as mean ± SD (unless otherwise stated). The
P‐value was calculated by two‐tailed unpaired
t‐test except for (B) in Prism7. *
P <
0.05, **
P <
0.01, ***
P <
0.001.

