-
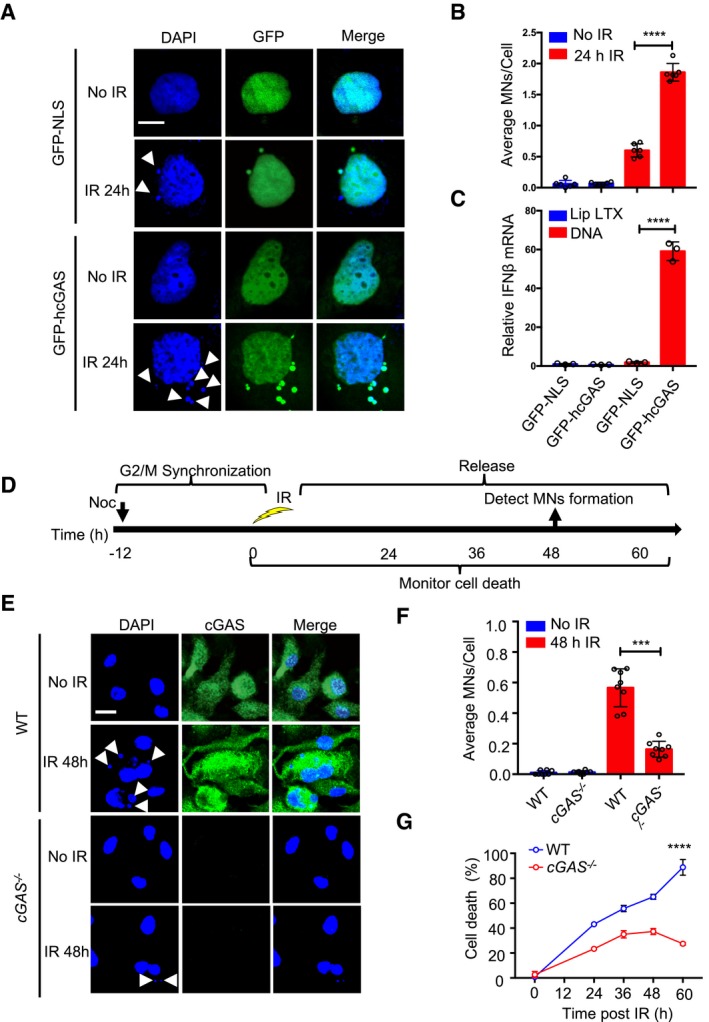
A, B
Micronuclei (indicated by arrowhead) in GFP‐NLS‐ or GFP‐hcGAS‐expressing HEK293 cells before (0 h) or 24 h after γ‐irradiation (IR; 10 Gy). Scale bar: 10 μm (A). (B) The average MNs/cell. Graphs show mean ± SEM (n = 3 independent experiments) representing six different microscopic fields with over 200 cells.
-
C
IFNB1 response in HEK293 cells stimulated with transfected plasmid DNA. Mean ± SEM of n = 3 independent experiments.
-
D
Experimental outline for micronucleus generation and cell death after γ‐irradiation.
-
E
Micronucleus (indicated by arrowhead) and cGAS staining in WT and cGAS−/− BMDMos exposed to γ‐irradiation (10 Gy). Scale bar: 10 μm.
-
F
Average MNs/cell in BMDMos. MN graphs show mean ± SEM (n = 3 independent experiments) representing eight different microscopic fields with over 200 cells.
-
G
Cell death in WT and cGAS−/− BMDMos that were first synchronized at G2/M, then γ‐irradiated (10 Gy) followed by release and analysis at indicated time points. Mean ± SD, x biological triplicates (n = 3) per treatment group are shown.
Data information: Statistical significance in (B), (C), and (F) was assessed using unpaired two‐tailed Student's
t‐test. ***
P ≤ 0.001 and ****
P ≤ 0.0001. Statistical significance in (G) was assessed using two‐way ANOVA test, ****
P < 0.0001.
Source data are available online for this figure.

