-
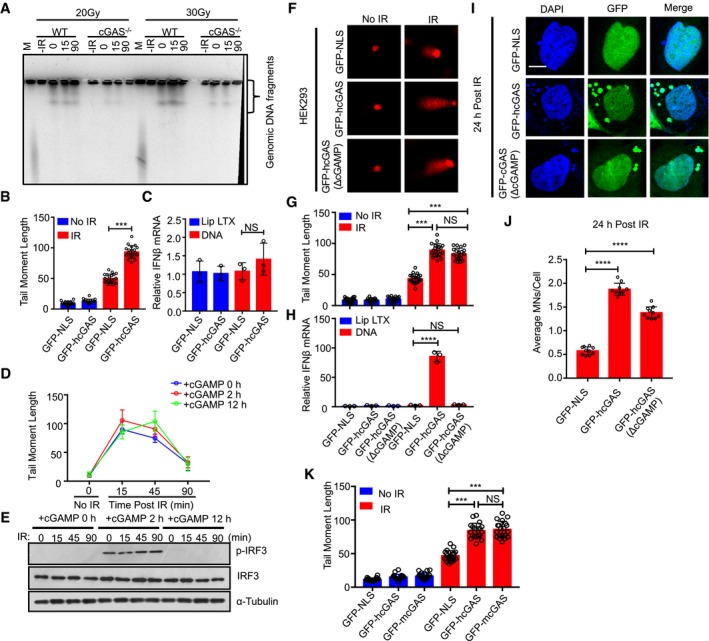
A
Pulsed‐field gel electrophoresis analysis of γ‐irradiated (10 Gy) WT and cGAS−/− BMDMos.
-
B, C
Comet assay in GFP‐NLS‐ and GFP‐hcGAS‐expressing HEK293T cells γ‐irradiated (IR: 10 Gy) for 15 min (B). RT–PCR analysis of IFNB1 response in GFP‐NLS‐ or GFP‐hcGAS‐expressing HEK293T cells stimulated with transfected DNA for 6 h (C).
-
D, E
Comet assay of HEK293 cells stimulated with 10 μg/ml cGAMP for indicate periods, then γ‐irradiated and incubated at 37°C for indicated duration (D). (E) Immunoblots of IRF3 phosphorylation in HEK293 cells treated as in (D).
-
F–H
Images (F) and quantifications (G) of comet tails 15 min after irradiation of GFP‐NLS‐, GFP‐hcGAS‐, and GFP‐hcGASΔcGAMP‐expressing HEK293 cells. RT–PCR analysis of IFNB1 response in GFP‐NLS‐ or GFP‐hcGAS‐expressing HEK293 cells stimulated with transfected 23 DNA for 6 h (H).
-
I, J
Images (I) and quantifications (J) of micronuclei in GFP‐NLS‐ and GFP‐hcGASΔcGAMP‐expressing HEK293 cells 24 h after γ‐irradiation (IR; 10 Gy). DAPI (DNA). Scale bar: 10 μm. Each data set bar comet graph was calculated from six different microscopic fields with over 200 cells.
-
K
Quantifications of comet tails 15 min after irradiation (10 Gy) of GFP‐NLS‐, GFP‐hcGAS‐, or GFP‐mcGAS‐expressing HEK293 cells. Each data set bar comet graph was calculated from six different microscopic fields with over 200 cells.
Data information: Statistical significance was assessed using one‐way ANOVA followed by Sidak's post‐test. NS
≤ 0.0001. Mean ± SEM of
= 3 independent experiments.