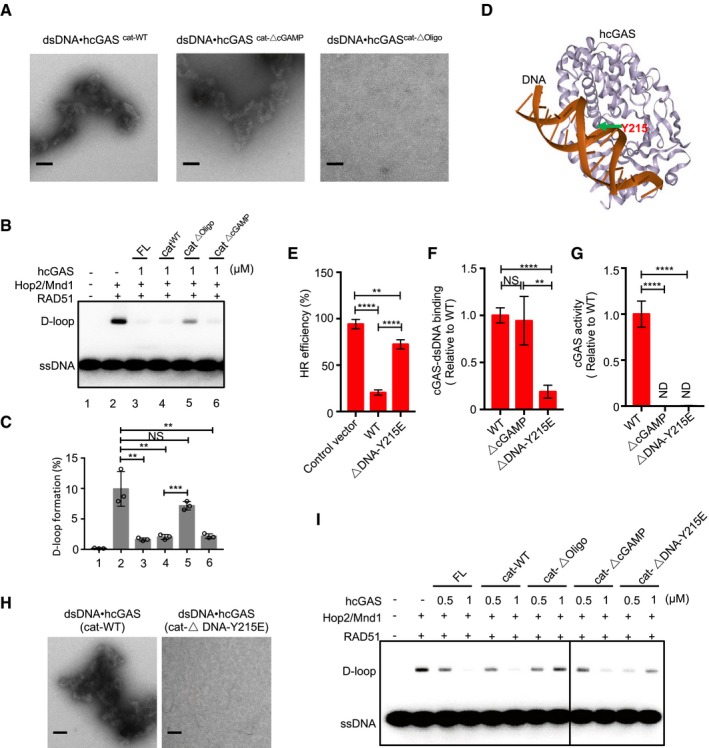
Figure 8. cGAS compacts dsDNA and inhibits D‐loop formation via oligomerization.

- Negative‐stain electron micrographs of cGAS‐dsDNA complexes following incubation of dsDNA with indicated cGAS variants. Scale bar: 100 nm.
- Effect of indicated hcGAS variants on D‐loop formation when pre‐incubated with dsDNA.
- Percentage of D‐loop formed in each reaction (left) graphed as the average of triplicates ± SD.
- Overview of a single 1:1 hcGAS‐DNA complex depicting the location of the Y215 within the cGAS‐dsDNA interface.
- DR‐GFP assay showing that hcGASΔDNA‐Y215E is impaired in HR inhibition.
- hcGASΔDNA‐Y215E but not hcGASΔcGAMP has a decreased affinity to dsDNA24.
- hcGASΔDNA‐Y215E and hcGASΔcGAMP are defective in synthase activity.
- Negative‐stain electron micrographs showing that hcGAScat‐ΔDNA‐Y215E is defective in inducing cGAS‐dsDNA complexes. Scale bar: 100 nm.
- Effect of indicated hcGAS variants on D‐loop formation.
