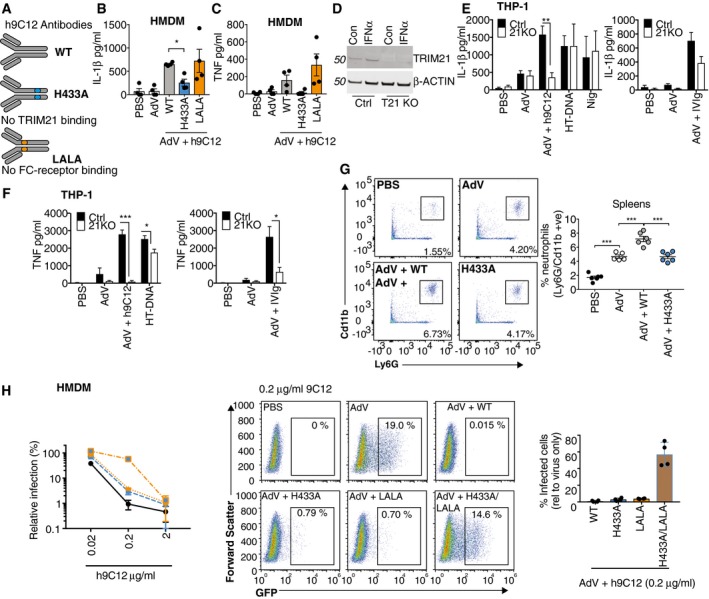
Figure 4. IL‐1β and TNF release in response to AdV and h9C12 monoclonal antibody is TRIM21 dependent.

-
ASchematic showing the h9C12 antibody mutants that no longer engage Trim21 (H433A) or FC receptors (LLAA).
-
B, C(B) Primed or (C) un‐primed HMDM were stimulated with AdV (50,000 pp/cell) +/− h9C12 (20 μg/ml) for 16 h (n = 4, mean ± s.e.m. *P ≤ 0.05, paired, two‐tailed t‐test).
-
DCtrl or Trim21‐deficient THP‐1s were stimulated for 4 h with 1,000 U/ml IFNα and TRIM21 expression measured by immunoblot.
-
E, FWT or TRIM21‐deficient THP‐1s were stimulated with AdV (50,000 pp/cell) and 20 μg/ml h9C12 or 20 mg/ml IVIg or with 200 ng/well HT‐DNA or 10 μM Nigericin for 16 h, and IL‐1β (E) and TNF (F) measured in the supernatant by ELISA (n = 4 (E) or n = 3 (F), mean ± s.e.m. *P ≤ 0.05, **P ≤ 0.005, ***P ≤ 0.001 unpaired, two‐tailed t‐test).
-
GWT mice were injected i.v. with 2.5 μg WT or H433A h9C12 antibody and then the next day injected i.v. with 2.5 × 10¹¹ pp AdV‐GFP. 4 h later spleens were harvested and neutrophil influx measured by flow cytometry (n = 6 mean ± s.e.m. ***P ≤ 0.001 unpaired, two‐tailed t‐test).
-
HHMDM were stimulated with AdV‐GFP (250 pp/cell) in the presence of h9C12 antibodies at indicated doses. Infection was measured after 24 h by flow cytometry. Infection relative to AdV alone is shown graphed on the left (n = 4 mean ± s.e.m). Representative plots and a comparison of the different h9C12 mutants at 0.2 μg/ml are also shown in the graph on the right (n = 4, mean ± s.e.m.).
Source data are available online for this figure.
