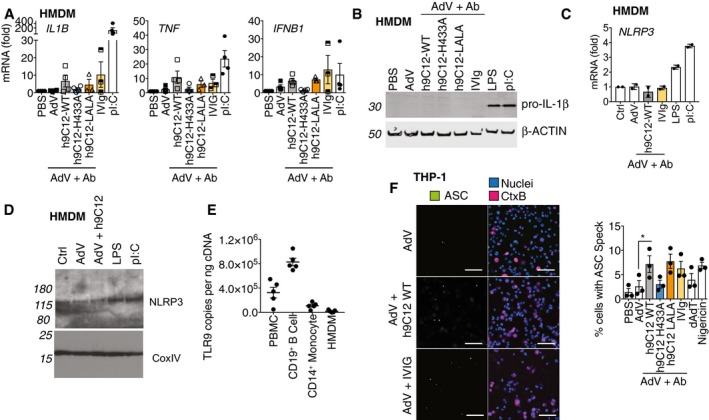
Figure 5. TRIM21 is involved in inflammasome activation rather than enhancing pro‐IL‐1β expression.

- HMDM were stimulated with AdV (50,000 pp/cell) and antibody (h9C12; 20 μg/ml, IVIg: 20 mg/ml) or 10 μg/ml pI:C for 3 h and gene expression was measured by qPCR (n = 4 mean ± s.e.m).
- HMDM were stimulated as in (A), or with 10 ng/ml LPS for 6 h and pro‐IL‐1β levels in the cytosol measured by Western blot. Blot is representative of three independent donors.
- HMDM were stimulated as in (A), or with 10 ng/ml LPS for 3 h and NLRP3 mRNA expression measured by qPCR. Data show average ± s.d. of two independent donors.
- HMDM were stimulated as in (B) and NLRP3 levels in the cytosol measured by Western blot. Blot is representative of two independent donors.
- TLR9 mRNA levels from PBMCs, CD19+ve B cells, CD14+ve monocytes or HMDM derived from CD14+ve monocytes were assessed by qPCR, and copy number was determined relative to actin copy number (n = 5 mean ± s.e.m).
- THP‐1s expressing ASC‐GFP were stimulated for 6 h with virus and antibody or 200 ng/well HT‐DNA or 10 μM Nigericin, in the presence of the pan‐caspase inhibitor zVAD‐fmk. A representative image (scale bar 100 μm) and quantification of number of cells with ASC specks from three independent experiments (mean ± s.e.m, *P ≤ 0.05, paired, two‐tailed t‐test) are shown.
Source data are available online for this figure.
