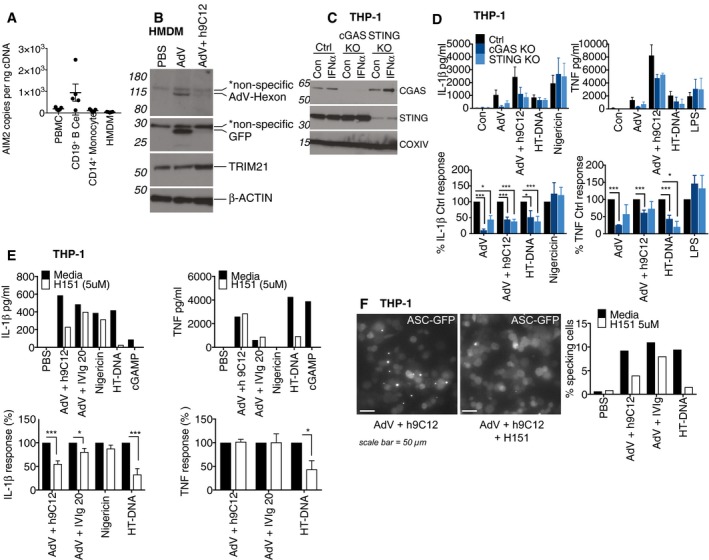
Figure 7. Trim21 exposes AdV genomes to cGAS and STING to trigger NLRP3‐dependent inflammasome activation.

- AIM2 mRNA levels from PBMCs, CD19+ve B cells, CD14+ve monocytes or HMDM derived from CD14+ve monocytes were assessed by qPCR, and copy number was determined relative to actin copy number (n = 5 mean ± s.e.m).
- HMDM were stimulated with AdV (50,000 pp/cell) and 20 μg/ml h9C12 for 1 h, washed 2× with SFM and then whole cell lysates harvested after a further 5 h. Viral hexon and transgene (GFP) expression in the cytosol was assessed by Western blot. Data are representative of two independent experiments.
- THP‐1s expressing either a control guide RNA or targeting cGAS and STING were generated and stimulated with 1,000 U/ml IFN‐α for 4 h and protein levels assessed by Western blot.
- THP‐1s deficient in cGAS and STING were stimulated with AdV (50,000 pp/cell) and 20 μg/ml h9C12, 200 ng/well HT‐DNA, 10 μM Nigericin or 10 ng/ml LPS for 16 h. Data show combined data (mean ± s.e.m) of three experiments with absolute protein values (upper panel) or as % cytokine output of KO cells relative to Ctrl‐treated cells (lower panel), *P ≤ 0.05, ***P ≤ 0.001 unpaired, two‐tailed t‐test).
- WT THP‐1s were treated with 5 μM H151 for 30 min before stimulation as in (D). Data in upper panel are representative of three independent experiments. Data in lower panel show combined data of these three experiments (mean ± s.e.m) showing H151‐treated cells relative to media treated cells (*P ≤ 0.05, ***P ≤ 0.001 unpaired, two‐tailed t‐test).
- ASC‐GFP THP‐1s were treated with 5 μM H151 for 30 min before stimulation with AdV‐mCherry (50,000 pp/cell) + 20 μg/ml h9C12 or 20 mg/ml IVIg or 200 ng/ well HT‐DNA for 8 h. A representative image (scale bar 50 μm) and quantification of number of cells with ASC specks from one representative experiment of three are shown.
Source data are available online for this figure.
