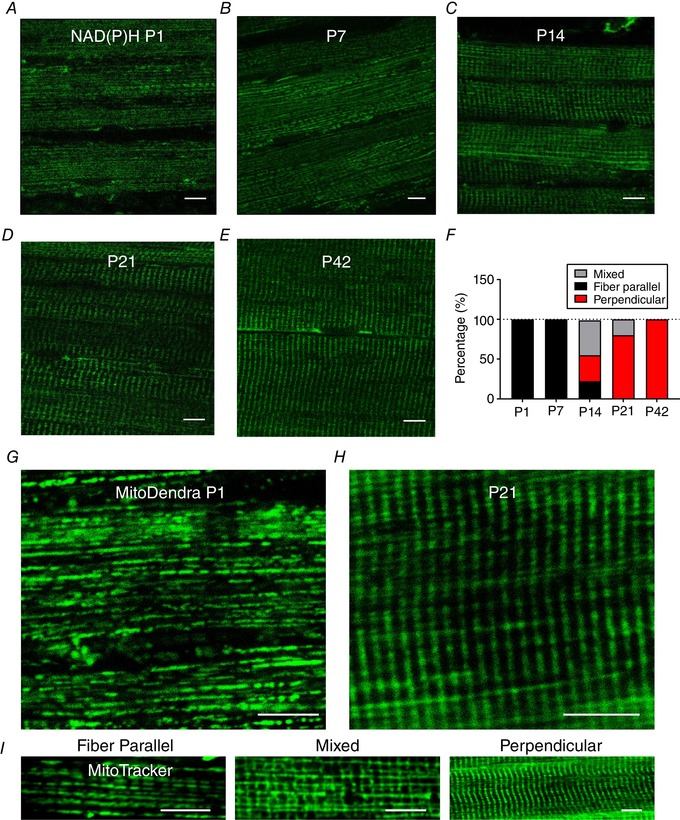
Figure 1. Change in mitochondrial network configuration in skeletal muscle during postnatal development.

A–E, using two‐photon microscopy of endogenous NAD(P)H fluorescence, mitochondrial configuration was observed in TA muscles of live C57BL/6 mice at P1–42. Pixel sizes of the NAD(P)H images were in the range 150–300 nm. Captured images of each group are displayed in individual panels (n = 3 per group). F, mitochondrial directionality was determined by at least 30 fibres per group and data are shown as a percentage (%). G–H, representative images (40–100 nm pixel sizes) of two‐photon microscopy of live MitoDendra mouse TA muscles at P1 and P21. I, representative two‐photon microscopy images of in situ MitoTracker Red fluorescence in C57BL/6 mouse TA muscles showing fibre parallel, mixed and fibre perpendicular mitochondrial network orientations. Scale bars = 10 μm.
