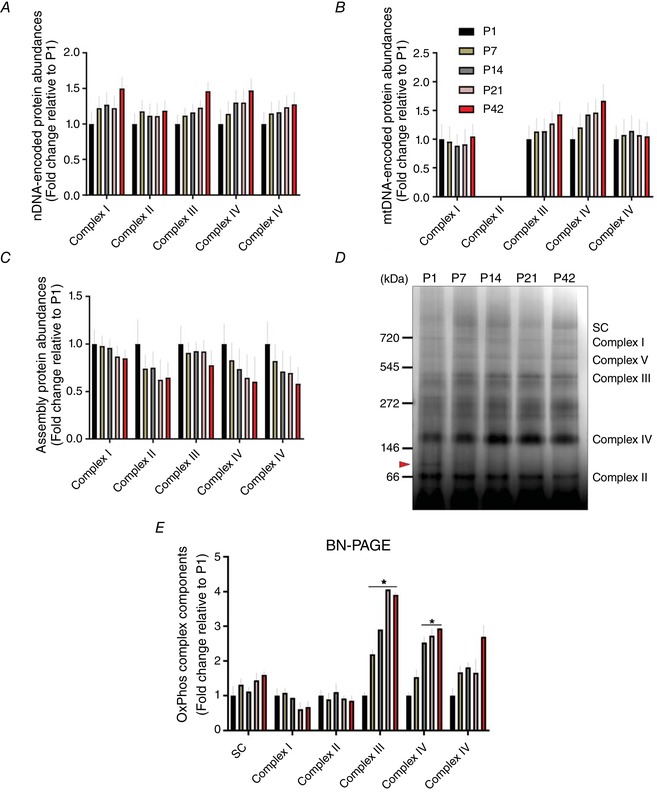
Figure 2. Developmental change of OxPhos components in skeletal muscle.

Fold changes of protein abundances for nDNA‐ (A) and mtDNA‐ (B) encoded OxPhos components across postnatal development, as well as (C) OxPhos assembly proteins compared to P1 (n = 4 per group; 3–5 pooled tissues for P1 and P7 groups, respectively). D, representative image of BN‐PAGE shows change in OxPhos protein subunits in TA muscles along with OxPhos supercomplexes (SC). An arrow between 66 and 146 kDa indicates a discrete band in P1. E, results of densitometry for BN‐PAGE. Data are shown as fold changes relative to P1 and are depicted as the mean ± SEM (* P < 0.05 vs. P1; n = 3 per group; 3–5 pooled tissues for P1 and P7 groups, respectively). [Color figure can be viewed at wileyonlinelibrary.com]
