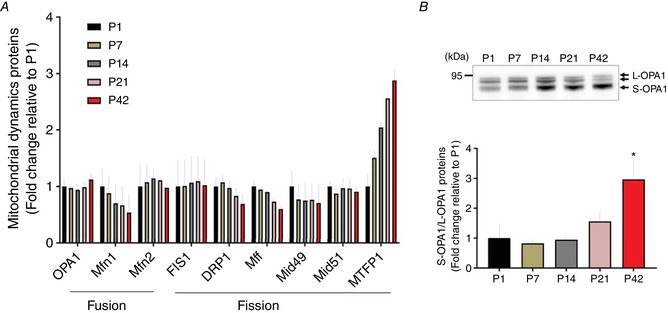
Figure 5. Change in mitochondrial dynamic proteins during postnatal muscle development.

A, fold changes of protein abundance of fusion and fission proteins are depicted (n = 4 per group; 3–5 pooled tissues for P1 and P7 groups, respectively) compared to P1. B, representative image of western blotting for OPA1. Long (L)‐ and short (S)‐OPA1 were separated by molecular weights (top). The ratio of S‐OPA1 to L‐OPA1 was examined and data (fold change relative to P1) are shown as the mean ± SEM. A significant difference was found between groups (* P < 0.05 vs. P1, n = 3 per group; pooled tissues for P1 and P7 groups, respectively). [Color figure can be viewed at wileyonlinelibrary.com]
