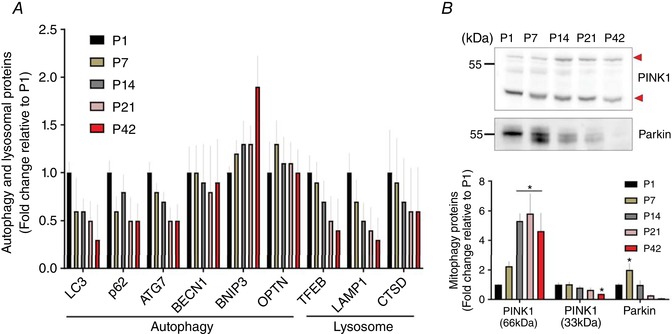
Figure 6. Change in muscle autophagic and mitophagic proteins across postnatal period.

A, changes of protein abundances for autophagic and lysosomal protein markers (n = 4 per group; 3–5 pooled tissues for P1 and P7 groups, respectively). B, representative images of western blotting for PINK1 and Parkin (top). In the results of PINK1, short forms of PINK1 (33 kDa; lower arrow) were downregulated from P1 to P42, whereas full‐length forms of PINK1 (66 kDa; upper arrow) were increased. Parkin protein expressions in TA muscles appeared to peak at P7 (* P < 0.05 vs. P1, n = 3 per group; 3–5 pooled tissues for P1 and P7 groups, respectively). [Color figure can be viewed at wileyonlinelibrary.com]
