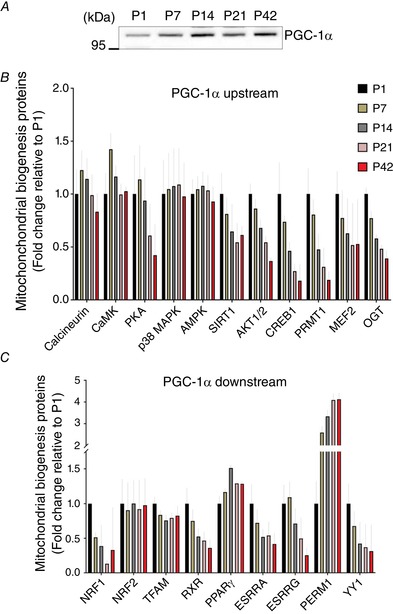
Figure 7. Change in mitochondrial biogenesis‐associated proteins in postnatal muscle growth.

A, representative image of western blotting for PGC‐1α (n = 3 per group). Fold changes of muscle proteomic data are shown for PGC‐1α (B) upstream and (C) downstream proteins compared to P1 (n = 4 per group; 3–5 pooled tissues for P1 and P7 groups, respectively). [Color figure can be viewed at wileyonlinelibrary.com]
