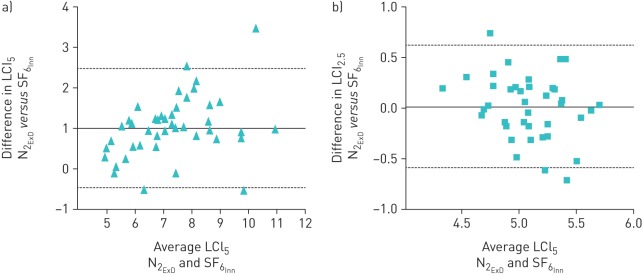
FIGURE 4.
Bland–Altman plots of the difference in lung clearance index (LCI) taken from the 1/20th end-point of the starting concentration (LCI5) between Exhalyzer D (nitrogen (N2ExD)) ExD) and Innocor (sulfur hexafluoride (SF6Inn)) in a) participants with cystic fibrosis (CF) and b) healthy control (HC) participants. The solid line is the mean difference between devices (1.0 in CF and 0.01 in HC) and the dotted lines represent the limits of agreement (−0.48–2.49 in CF and −0.59–0.62 in HC). The difference between devices becomes disproportionately larger with a higher (worse) LCI. The difference in LCI5 is not as large as the difference in LCI2.5.

