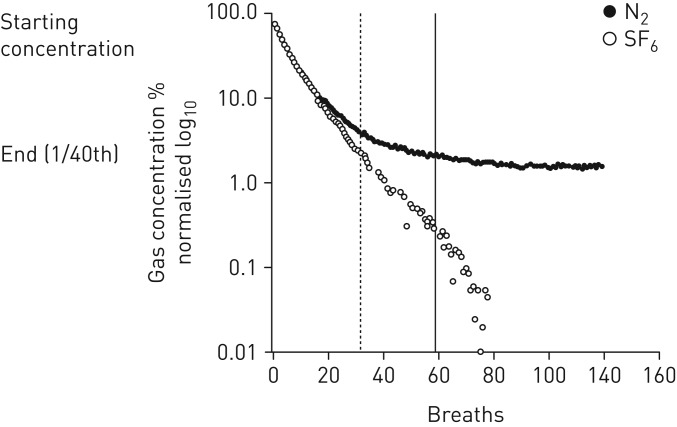
FIGURE 5.
Graph of an individual cystic fibrosis patient's gas concentration decline throughout a simultaneous washout of sulphur hexafluoride and nitrogen versus breath number. The gases are displayed in a normalised log scale for ease of visualisation. The vertical lines (dashed: SF6; solid: N2) represent the end-tidal gas concentration at 1/40th of the starting concentration; beyond this point is the extended washout period.

