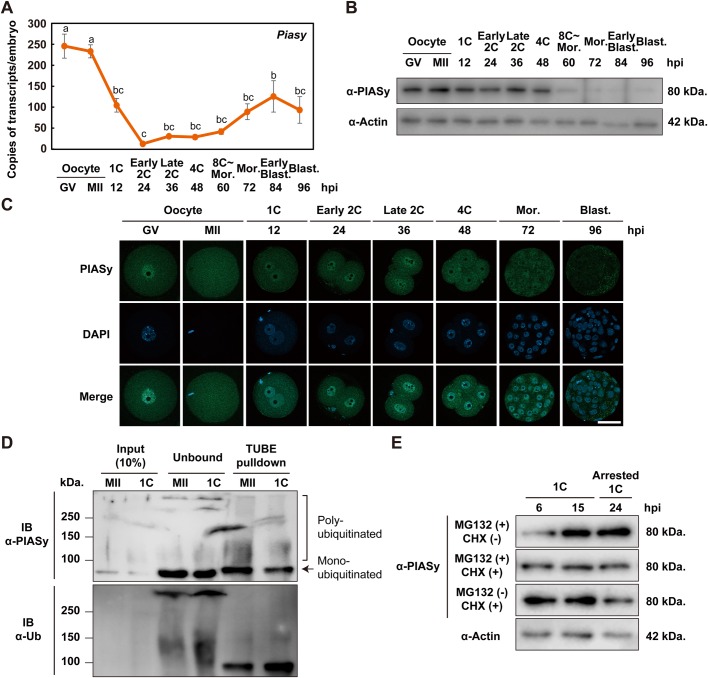
Fig. 2.
Maternal PIASy is degraded by UPS after fertilization. (A,B) Expression profiles of Piasy mRNA (A) and protein (B) in mouse oocytes and early embryos, determined by RT-qPCR using eight oocytes or embryos per stage, and western blot analysis using 30 oocytes or embryos per stage. Data represent mean±s.e.m. and different letters indicate statistical significances (Tukey–Kramer test; P<0.05). Actin was used as a loading control. Molecular masses (kDa) are shown on the right. (C) Subcellular localization of PIASy (green) in oocytes at the germinal vesicle (GV) and MII stages and in embryos till the blastocyst stage at 96 hpi (more than ten embryos were examined in each condition). All nuclei were stained by DAPI (blue). Scale bar: 50 µm. (D) Endogenous poly- and mono-ubiquitination of PIASy in mouse MII oocytes and one-cell zygotes. 200 oocytes and zygotes were collected and lysed by lysis buffer. The lysates were subjected to TUBE-pulldown assay to enrich for ubiquitinated proteins, followed by an immunoblot with anti-PIASy (upper panel) or anti-Ub antibody (lower panel). Molecular masses (kDa) are shown on the left. (E) One-cell zygotes at 6 hpi were treated with or without cycloheximide (CHX) in the presence of MG132 and lysed at the indicated time. The lysates were subjected to western blot analysis with anti-PIASy antibody. Total proteins from 30 zygotes were loaded in each lane. Representative western blot analysis of PIASy protein levels and one representative actin loading control are shown. MII, metaphase II oocyte; 1C, one-cell; 2C, two-cell; 4C, four-cell; Mor., morula; Blast., blastocyst.

