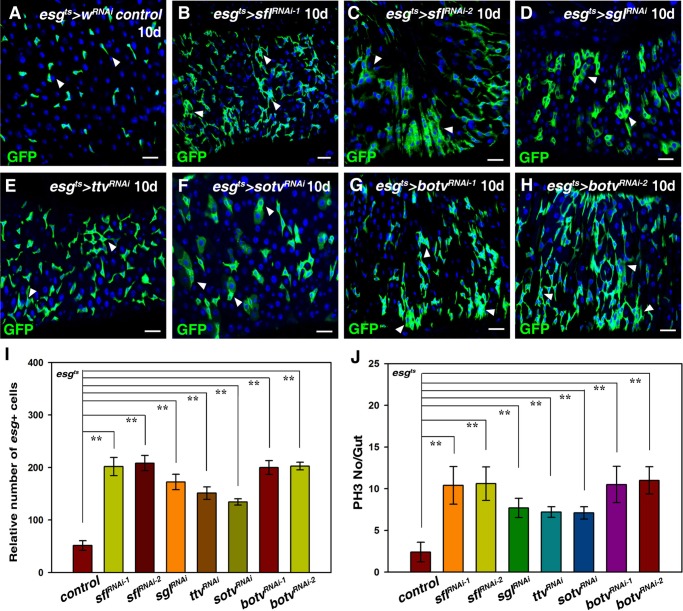
Fig. 1.
HS in progenitors restricts ISC proliferation. (A) esg+ cells (green) in control flies at 29°C for 10 days (white arrowheads). (B,C) The number of esg+ cells (green) is dramatically increased in esgts>sflRNAi flies at 29°C for 10 days (white arrowheads). (D) The number of esg+ cells (green) is dramatically increased in esgts>sglRNAi flies at 29°C for 10 days (white arrowheads). (E) The number of esg+ cells (green) is dramatically increased in esgts>ttvRNAi flies at 29°C for 10 days (white arrowheads). (F) The number of esg+ cells (green) is dramatically increased in esgts>sotvRNAi flies at 29°C for 10 days (white arrowheads). (G,H) The number of esg+ cells (green) is dramatically increased in esgts>botvRNAi flies at 29°C for 10 days (white arrowheads). (I) Quantification of the relative number of esg+ cells in the different genotypes indicated. mean±s.d. is shown. n=10–15 intestines. **P<0.01. (J) Quantification of the number of pH3 per gut in the different genotypes indicated. mean±s.d. is shown. n=10–15 intestines. **P<0.01. In all panels except graphs, GFP is in green and blue indicates DAPI staining for DNA. Scale bars: 20 μm.

