Fig. 3.
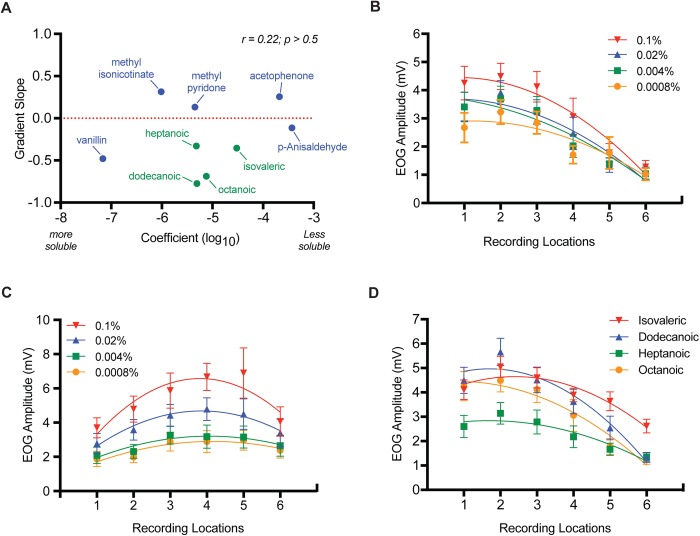
The effects of mucus solubility, functional group and concentration on EOG gradients. (A) For the highest odor concentrations only (see Results and below for justification), the relationship between the slope of the mean EOG response-gradient across six recording locations and air-mucus partition coefficients (Log10) is plotted. Pearson-r correlation and P-values are shown. (B) Mean (±s.e.m.; n=9 mice) EOG response amplitudes across six recording locations using half-log dilution series of octanoic acid. (C) Mean (±s.e.m.; n=12 mice) EOG response amplitudes across six recording locations using half-log dilution series of acetophenone. Note for B and C that concentration has little effect on the slope or shape of the response gradient across endoturbinate IId. (D) Mean (±s.e.m.; n=9–18 mice depending on odor) response gradients across six recording locations for four fatty acids (see text for explanation of stimulus concentrations and slope statistics).

