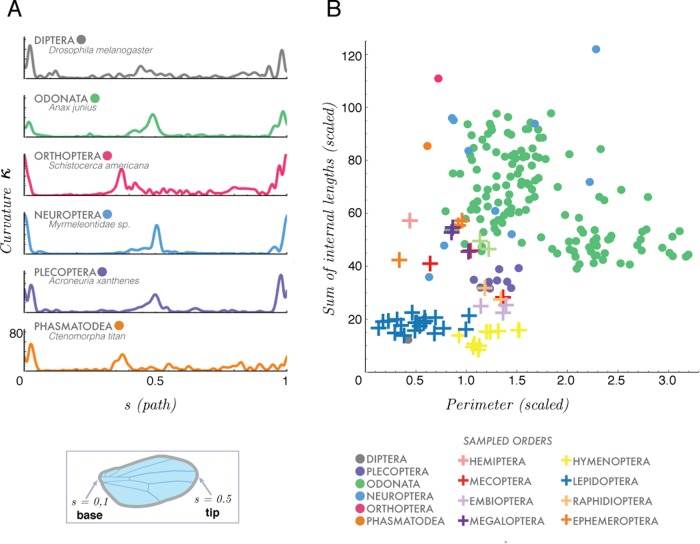
Fig. 3.
Wing shape, contour and internal venation. (A) Comparison of three geometric traits (of all sampled orders) where contour is defined using a scaled curvature (κ) (scaled by total perimeter P) as a function of arc length (or path), s. Curvature is plotted along path s where s=0 at the wing base and s=0.5 at the wing tip. Contour for six orders is represented. (B) Our second trait characterizes venation density of 298 wings, where the total sum of all internal vein lengths, L (scaled by the perimeter P), is plotted as a function of our third trait, normalized perimeter P (scaled by the square root of the area of the wing, see text). Species (per insect order) are represented by either circles or crosses.

