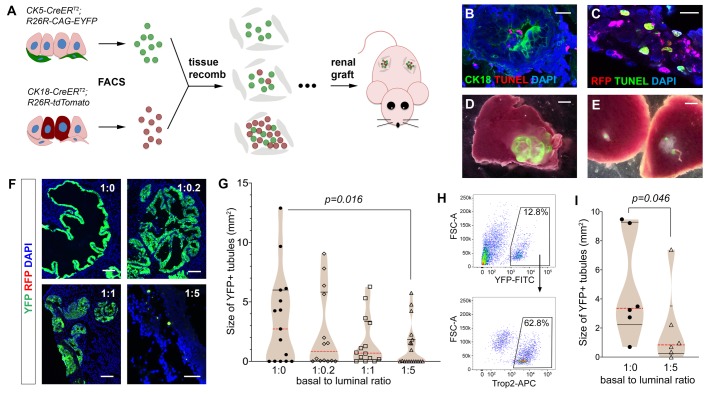
Fig. 1.
Analyzing the effects of mixing basal and luminal cells in prostate tissue reconstitution assay. (A) Diagram of renal grafting experiments with different ratios of basal and luminal cells. (B,C) IF and TUNEL staining of day 7 renal graft showing apoptotic signals in a fraction of luminal cells marked by CK18+ (B) or RFP+ (C). Scale bars: 20 μm. (D,E) YFP and white field overlay dissection images showing a graft of the 1:0.2 ratio (D) and grafts of the 1:5 ratio (E). Scale bars: 1 mm. (F) Representative images showing direct visualization for YFP and RFP signals in sectioned grafts. Scale bars: 100 μm. (G) Violin plot comparing YFP+ tubule sizes for all the grafts with different basal-to-luminal ratios by Mann–Whitney U-test. Black lines show quartiles and red dashed lines show medians. (H) FACS gating for sorting Trop2+ basal cells. (I) Violin plot comparing sizes of YFP+ tubules derived from Trop2+ basal cells in the cell mixture experiment by Mann–Whitney U-test.

