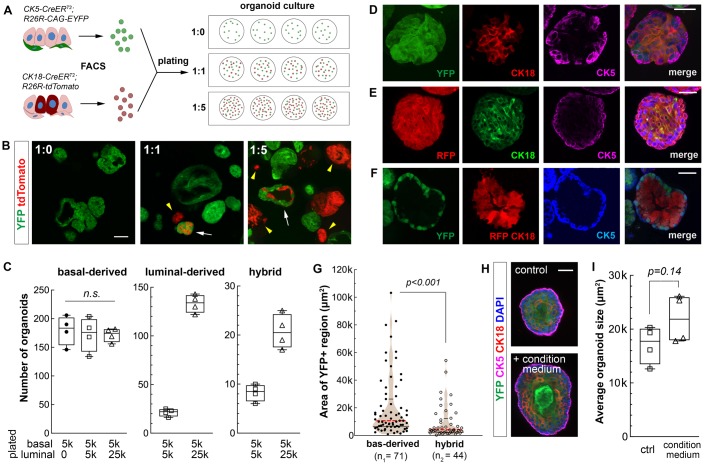
Fig. 2.
Effects of co-culturing luminal cells on basal stem cell activities in prostate organoid assay. (A) Diagram of organoid culture experiments plated with different ratios of basal and luminal cells. (B) Direct visualization of YFP and RFP signals in organoids under different ratio conditions. White arrows, hybrid organoids. Yellow arrowheads, luminal-derived organoids. Scale bar: 100 μm. (C) Box plot comparing organoid numbers for each type per well (N=4) under different basal-luminal mixture conditions. n.s., not significant by Student's t-test. (D–F) IF images showing basal-to-luminal differentiation in a basal-derived organoid (D), luminal-to-basal differentiation in a luminal-derived organoid (E), and cell lineage restriction in a hybrid organoid (F). Scale bars: 50 μm. (G) Violin plot comparing YFP+ areas between basal-derived organoids and hybrid organoids by Mann–Whitney U-test. Black lines show quartiles and red dashed lines show medians. (H) Representative IF images showing basal-derived organoid cultured with standard medium or luminal-conditioned medium. Scale bar: 50 μm. (I) Box plot comparing average size of basal-derived organoid per well (N=4) with and without luminal-conditioned medium by Student's t-test.

