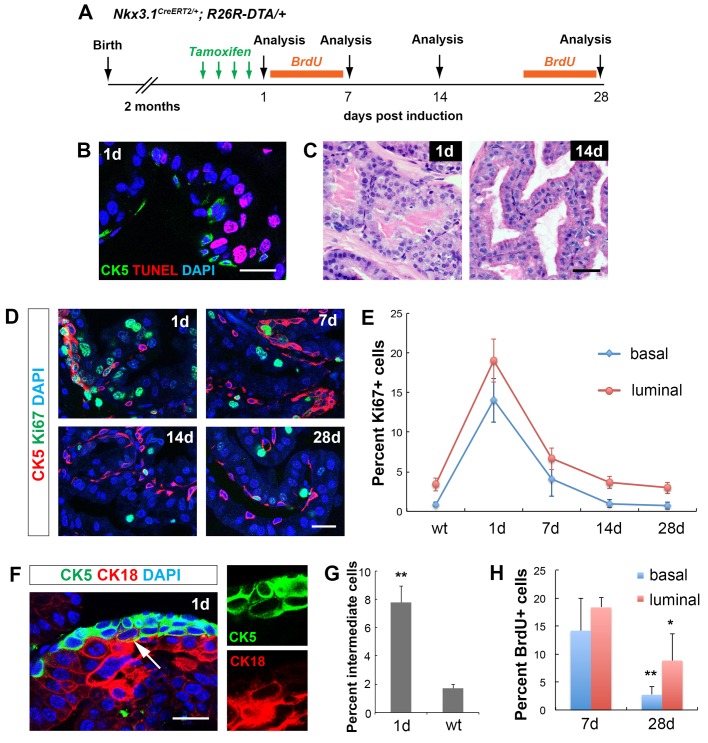
Fig. 3.
Cell dynamics during the epithelial repair process upon luminal cell ablation. (A) Timeline of experiments of luminal cell-specific ablation. (B) IF and TUNEL staining 1 day after tamoxifen induction. Scale bar: 20 μm. (C) H&E images showing 1 day and 14 days prostate epithelium. Scale bar: 50 μm. (D) IF images showing proliferating cells in basal and luminal cells at different time points of tissue repair. Scale bar: 20 μm. (E) Quantitation of Ki67 index in the basal and luminal cell populations at different time points of tissue repair. (F) IF image showing basal cell over-proliferation and CK5+CK18+ intermediate cells (arrow) at 1 day. Scale bar: 20 μm. (G) Comparison of intermediate cell percentage between 1 day and wild-type control. (H) Quantitation of basal and luminal cell proliferation by BrdU incorporation assay during tissue repair. Error bars in E,G,H correspond to one s.d. N=3 animals per time point. **P<0.001; *P<0.01 by two-tailed Student's t-test.

