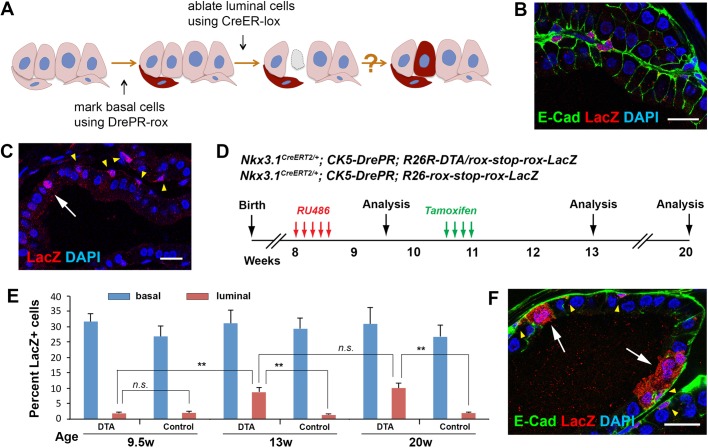
Fig. 4.
Lineage-tracing of basal cells upon luminal cell DTA ablation. (A) Diagram of using the dual-lineage system to trace basal cells. (B) IF showing basal cell labeling upon RU486 treatment of BasLacZ mice. (C) IF showing a leaked luminal cell (white arrow) that was labeled together with basal cells (yellow arrowheads). (D) Timeline of lineage tracing experiments in LumDTA; BasLacZ and LumWT; BasLacZ mice. (E) Quantitation of percentages of LacZ+ cells in basal and luminal cells at different time points in LumDTA; BasLacZ (DTA) and LumWT; BasLacZ (control) mice. N=3 animals per time point in each cohort. Error bar, one s.d. **P<0.001 by two-tailed Student's t-test. (F) IF showing LacZ+ cell clusters that contained differentiated luminal cells (white arrows). Yellow arrowheads point to LacZ+ basal cells in isolation or within the clusters. Scale bars in B,C,F correspond to 20 μm.

