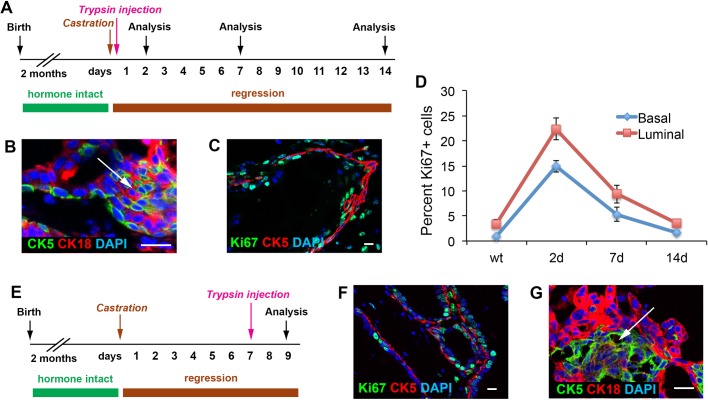
Fig. 6.
Analysis of basal cells after trypsin injection in androgen-deprived prostate. (A) Timeline of experiment of simultaneous trypsin injection and castration. (B,C) IF images showing emergence of intermediate cells (B, arrow) and high proliferation rate in both basal and luminal layers (C) 2 days after trypsin injection. (D) Quantitation of Ki67 index in the basal and luminal cell populations at different time points of tissue repair. N=3 animals per time point. Error bars correspond to one s.d. (E) Timeline of experiment of trypsin injection 1 week after mice castration. (F,G) IF images showing high proliferation rate in both basal and luminal layers (F) and emergence of intermediate cells (G, arrow) 2 days after trypsin injection. Scale bars in B,C,F,G correspond to 20 μm.

