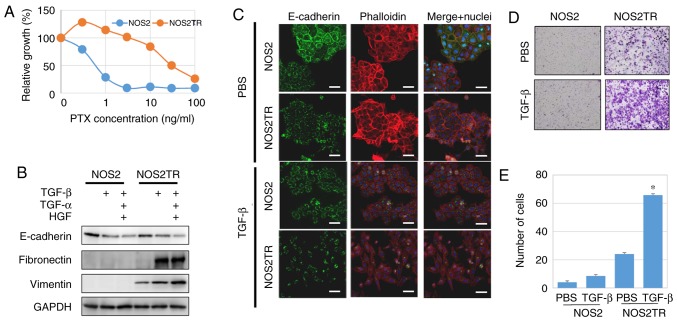
Figure 4.
(A) Generation of two independent PTX-resistant cell lines using NOS2 cells by continuous exposure to stepwise-increasing concentrations of PTX. PTX sensitivity of the chronic PTX-resistant cells was assayed as described in Materials and methods. (B) Western blot analysis of E-cadherin, fibronectin and vimentin in the NOS2 and NOS2TR cells following treatment with TGF-β (10 ng/ml), TNF-α (100 ng/ml) and HGF (40 ng/ml). (C) Immunofluorescence expression of E-cadherin in NOS2 and NOS2TR cells with or without TGF-β (10 ng/ml). Scale bars, 50 µm. (D) Images of the migration assay and quantitative analysis of the migration cell number. (E) *P<0.05 compared to the PBS control. PTX, paclitaxel; TGF-β, transforming growth factor-β; HGF, hepatocyte growth factor; TNF-α, tumor necrosis factor-α.

