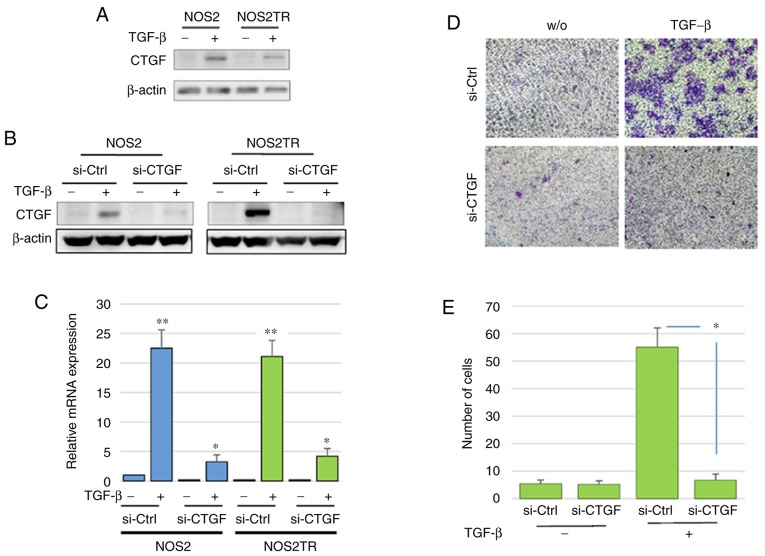
Figure 5.
(A) Western blot analysis of the protein expression of CTGF in NOS2 and NOS2TR cells with or without TGF-β (10 ng/ml). The addition of TGF-β resulted in increased CTGF expression. (B) The protein expression of CTGF in NOS2 and NOS2TR cells. The TGF-β-induced CTGF expression was completely inhibited in CTGF-depleted NOS2 and NOS2TR cells compared with that of the control siRNA-transfected cells. (C) qPCR of CTGF mRNA expression. *P<0.05, **P<0.01, significant difference compared to the si-Ctrl group. (D) The migratory ability of the si-CTGF or si-Ctrl transfected NOS2TR cells in the presence or absence of TGF-β (10 ng/ml). (E) The number of migrating cells. *P<0.05, significant difference compared with the si-Ctrl group. CTGF, connective tissue growth factor; TGF-β, transforming growth factor-β.

