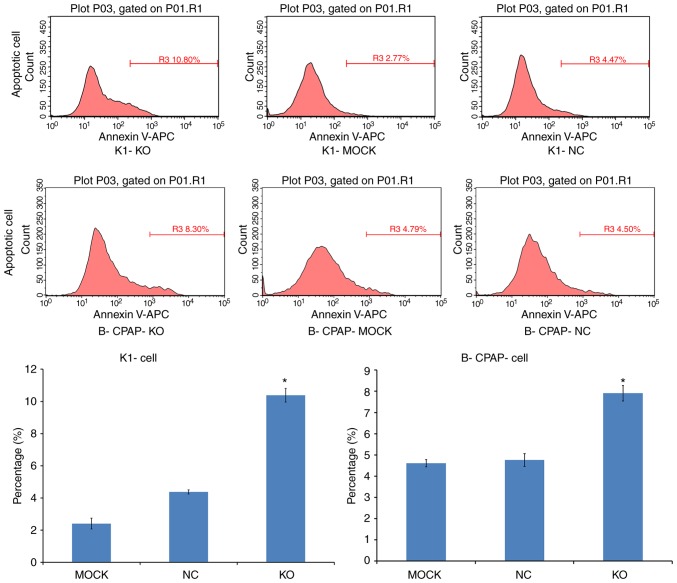
Figure 5.
Effect of Ku80 knockdown on K1 and B-CPAP cell apoptosis. Peak figures of K1-Cas9 and B-CPAP-Cas9 cells in various experimental groups are shown above, with the respective quantitation shown in graphs below (*P<0.05 vs. NC cells). KO, experimental group; NC, negative control group; MOCK, blank control group.

