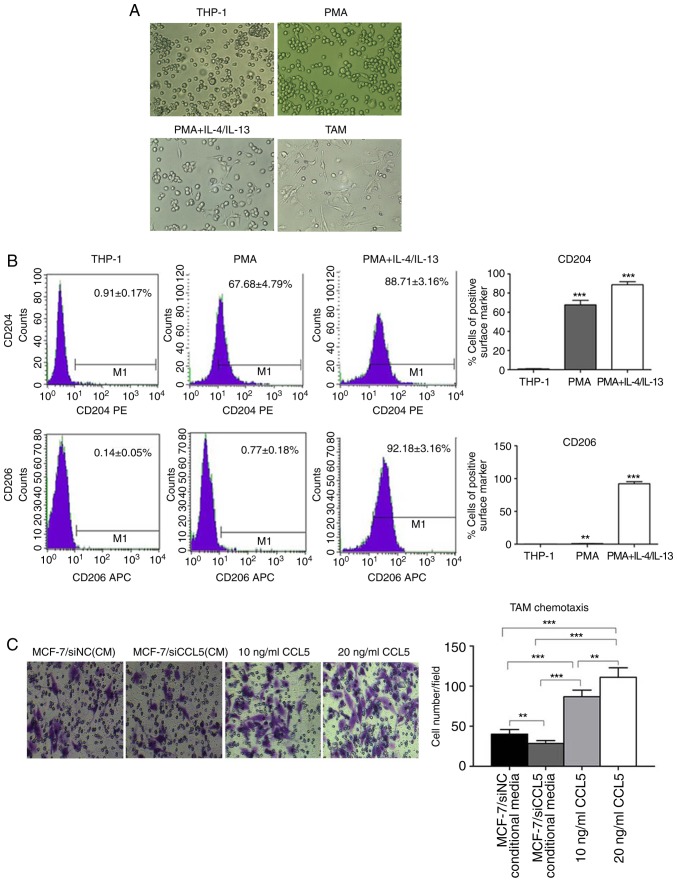
Figure 5.
Morphological analysis and surface marker determination of TAMs induced from THP-1 cells in vitro. (A) THP-1 cell morphology (magnification ×200) and cell morphology following treatment with PMA for 24 h (magnification ×200). Cell morphology was analyzed following treatment with PMA for 24 h, and IL-4 and IL-13 for 18 h (magnification ×200). TAM cell morphology cultured after 24 h (×200) was also analyzed. (B) The expression of CD204 and CD206 on the surface of THP-1 cells before and after induction was investigated. **P<0.01, ***P<0.0001 vs. THP-1. (C) Transwell assay of chemotaxis ability of CCL5 to TAMs (magnification ×200), **P<0.01, ***P<0.001. APC, allophycocyanin; CCL5, C-C motif chemokine ligand 5; IL, interleukin; PMA, phorbol-12-myristate-13-acetate; TAMs, tumor-associated macrophages.

