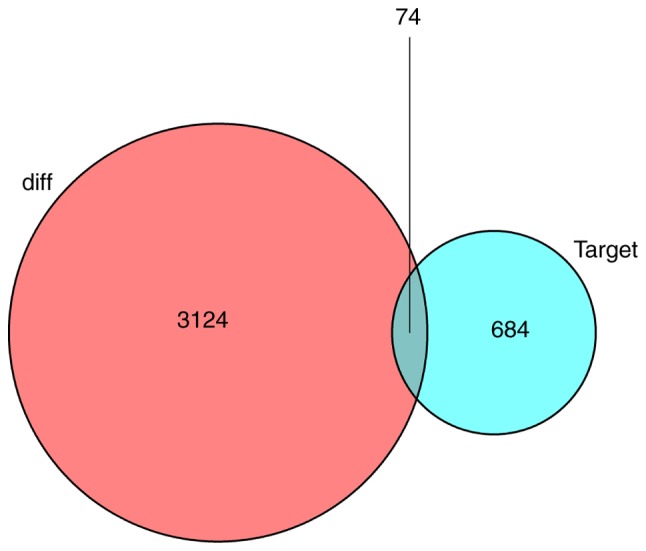
Figure 2.

Venn diagram of differentially expressed mRNAs involved in the competing endogenous RNA network. The red circle represents the differentially expressed genes, and the blue circle represents the target genes of miRNAs in the competing endogenous RNA network.
