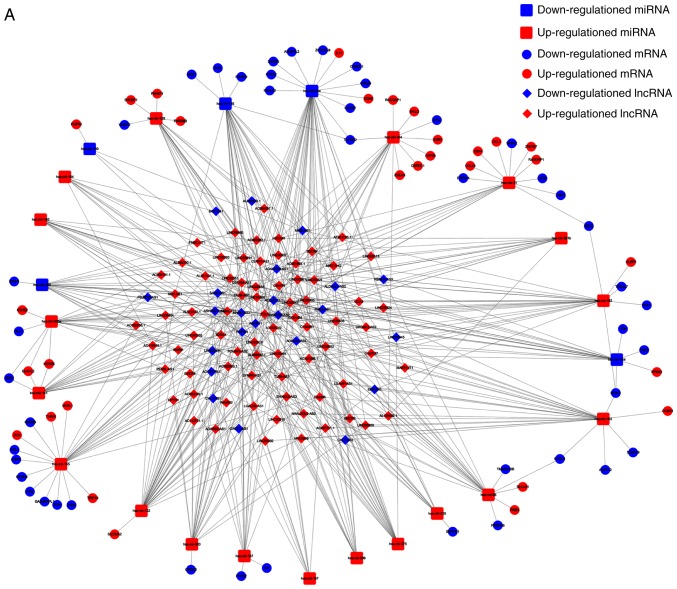
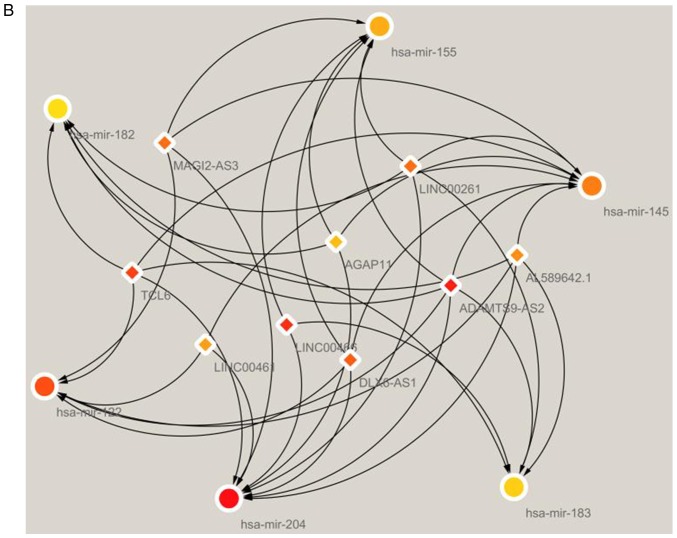
Figure 3.
Schematic of the ceRNA network of lncRNA-miRNA-mRNA in breast cancer. (A) The complete network is shown, with diamonds indicating IncRNAs, rounded rectangles indicating miRNAs, and ellipses indicating mRNAs. The red and blue nodes represent upregulation and downregulation, respectively. (B) The hub closeness network involved in the ceRNA network. ceRNA, competing endogenous RNA; lncRNA, long non-coding RNA; miRNA, microRNA.


