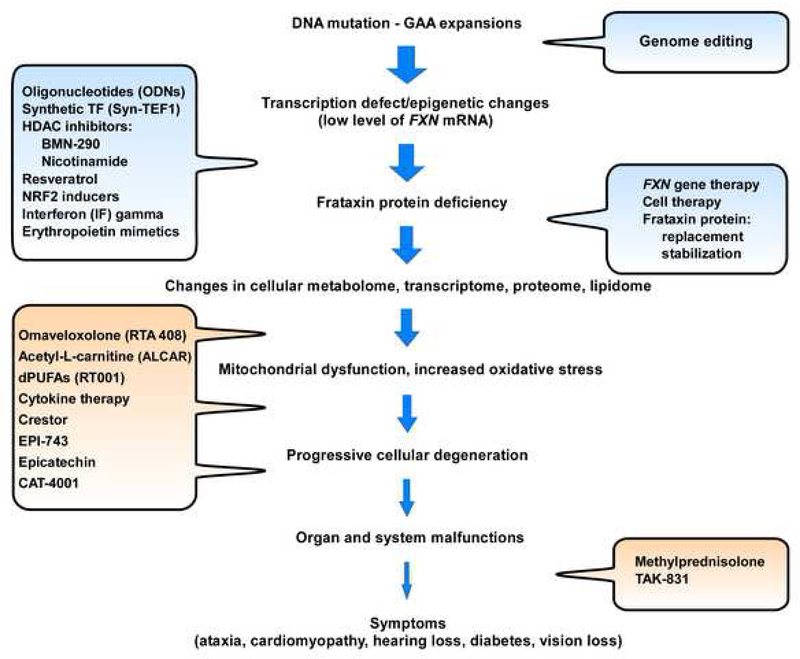
Box 1, Figure I. Multi-level therapeutic strategies for FRDA.
The flow diagram illustrates many phases underlying disease manifestation in FRDA, highlighting multiple and diverse opportunities for therapeutic intervention (text bubbles). Strategies aimed to increase FXN/frataxin levels are shown in blue, while approaches aimed at improving consequences of frataxin deficiency are shown in orange. The clinical development stage for these strategies can be found on the Friedreich’s Ataxia Research Alliance websitei.

