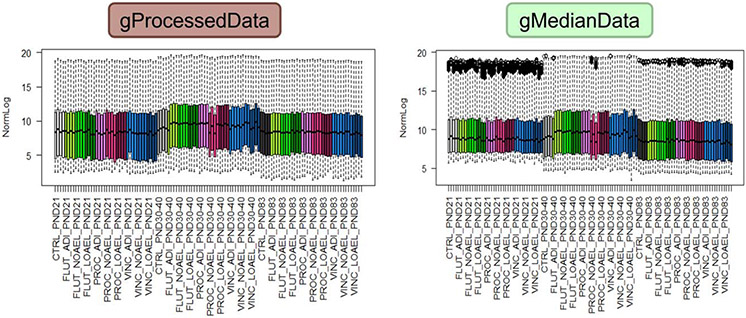
Figure 2: Boxplots of the non-normalised log2 data from the EMSG56 study comparing data that are based upon the Agilent Technologies gProcessedSignal (left) with those that are based upon the gMedianSignal (right).
Footnote to Figure 2: The data are derived from 120 microarrays across three time points (postnatal days (PND) 21, 30-40, 83). At each time point, a total of 10 samples were measured, i.e. the control and three concentrations each for the three substances flutamide (FLUT), prochloraz (PROC) and vincolzalin (VINC). The three concentrations were set to represent each substance’s acceptable daily intake level (ADI; the low dose), no observed adverse effect level (NOAEL; the mid-dose) and lowest observed adverse effect level (LOAEL; the high dose). Each dose/time combination is indicated by a colour, and there are four experimental sets of data at each combination. The data are either the gProcessedSignal data or the gMedianSignal data and have been transformed to the log2. For each measurement, the coloured boxes represent the first to third quartile, the dotted lines the minimum to maximum values, and the black circles (for the gMedianData) outliers that have exceeded the intensity threshold for the scanner.

