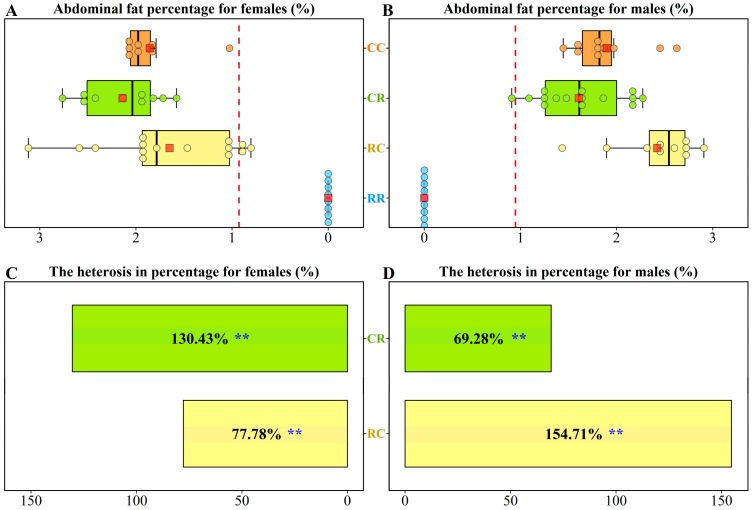
Figure 1.
Boxplots for the abdominal fat percentages of the four groups: (A) females, (B) males. Orange, green, yellow, and blue boxes represent the CC, CR, RC, and RR groups, respectively. Each dot represents an individual. The central red point in each box represents the average value in the corresponding group. The red dashed line represents the average of the two parental lines (termed the mid-parent value). Heterosis of abdominal fat percentages for reciprocal crosses: (C) females, (D) males. Green and yellow boxes represent the CR and RC groups, respectively. The values of heterosis for the CR and RC groups are presented in the corresponding boxes. Significance was analyzed by Student’s t-test and ** indicates that p-value is <0.01.

