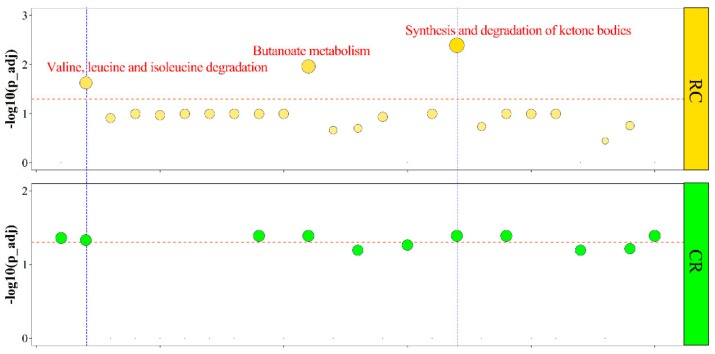
Figure 3.
Kyoto Encyclopedia of Genes and Genomes (KEGG) pathway analysis of over-dominant genes for the RC and CR groups. Each KEGG pathway is represented by a dot. The area of a dot represents the number of genes enriched in the pathway. The dashed orange lines represent significant levels (adjusted p-value < 0.05). Dots that pass the blue dashed line represent significant KEGG pathways. Descriptions of the significant pathway are displayed above the dots.

