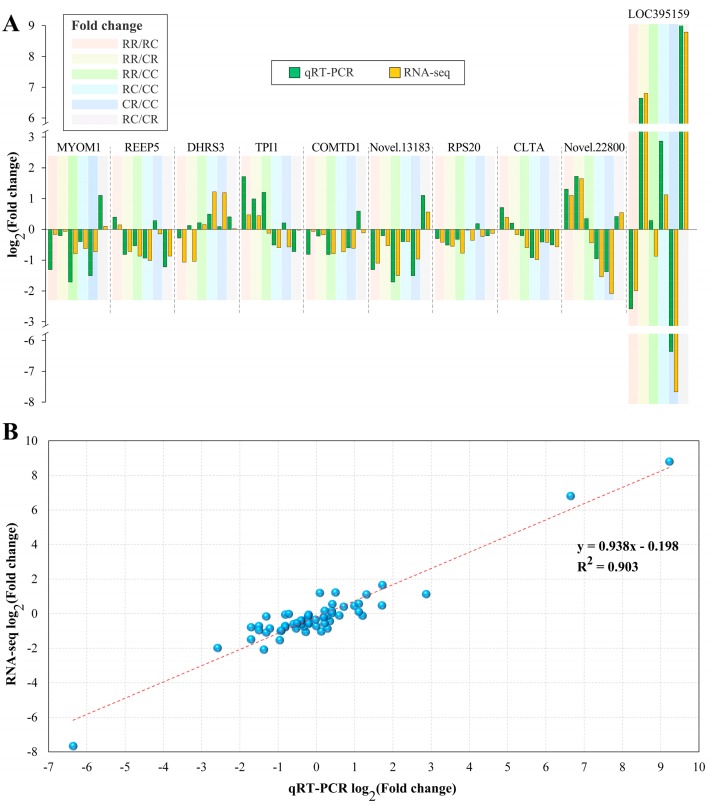
Figure 4.
qRT-PCR validation of differentially expressed genes (DEGs) in four groups. (A) Comparison of log2(fold change) in ten DEGs between qRT-PCR and RNA-seq, and (B) regression analysis of log2(fold change) values between qRT-PCR and RNA-seq. A high R2 indicated that the RNA-seq data were considered to be of a high accuracy.

