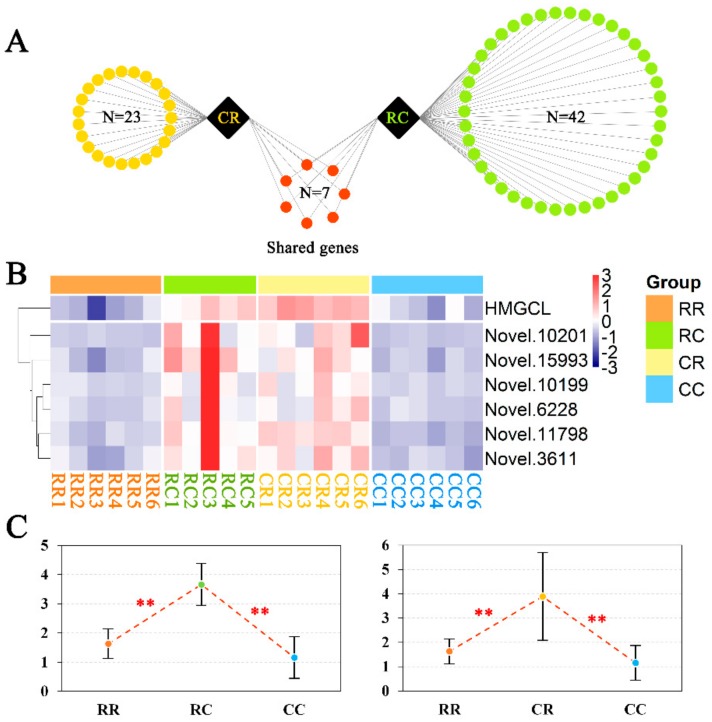
Figure 5.
Analysis of over-dominant genes for the CR and RC groups. (A) Statistical analysis of the number of over-dominant genes for the CR and RC groups. Each yellow or green dot represents an over-dominant gene for CR or RC, respectively. Red dots represent the shared over-dominant genes for the CR and RC groups. (B) Gene expression levels of shared over-dominance for the four groups. The orange, green, yellow, and blue rectangles above the graph represent the RR, RC, CR, and CC groups, respectively. The names of the shared over-dominant genes are displayed on the right-hand side of the graph. Genes with high and low expression levels are displayed in red and blue, respectively. (C) qRT-PCR validated the gene expression modes of over-dominance for HMGCL. Because HMGCL was the shared gene of the CR and RC groups, which was significantly enriched in pathways of butanoate metabolism; synthesis and degradation of ketone bodies; and valine, leucine, and isoleucine degradation, we performed qRT-PCR to validate the gene expression modes. Differences between the two groups were analyzed by Student’s t-test with the SAS system. The data are expressed as the mean ± SD. * p < 0.05; ** p < 0.01.

