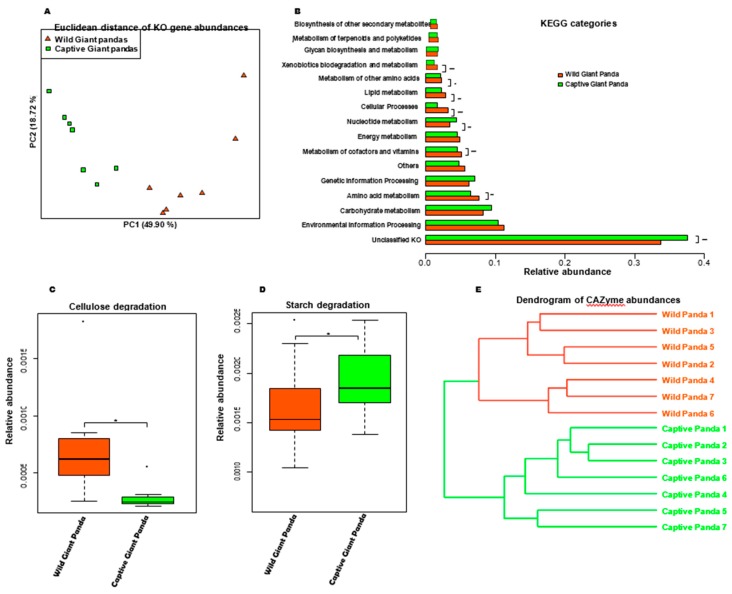
Figure 2.
Metagenomic analysis of the functional potential of the giant panda microbiome. (A) Principal coordinates analysis based on Euclidean distances of all functional genes and pathways shows distinct clustering patterns between wild and captive pandas. (B) The relative abundances of KEGG Orthology. The relative abundance of CAZy families for cellulose (C) and starch (D) degradation. Boxplot indicates the interquartile range (IQR), lines inside boxes denote the median, and error bars represent the lowest and highest values, respectively. (E) UPGMA-clustered CAZyme dendrogram. * p < 0.05, ** p < 0.01, and *** p < 0.001, Mann–Whitney U test.

