Figure 4.
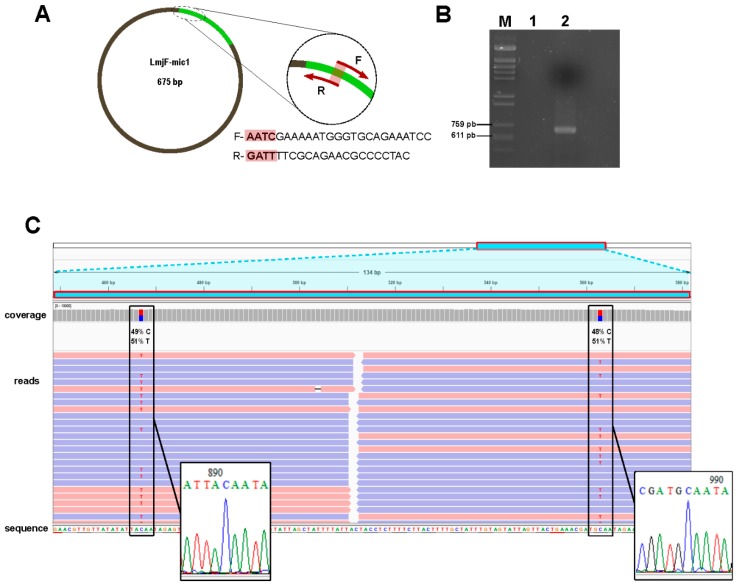
PCR validation of minicircle assemblies. (A) Primer design scheme based on the L. major minicircle 1 (LmjF-mic1). Primers F (forward) and R (reverse), shown as maroon arrows, were designed on the conserved region of the minicircle (green area). The primers overlap by 4-nt. (B) Analysis by agarose gel electrophoresis of the PCR amplification product (lane 2) and negative control (lane 1) contains the amplification in the absence of DNA template. HindIII-digested phi29-DNA was used as molecular weight marker (lane M) loaded; the length (in bp) of the marker bands with a size close to the amplification product are indicated on the left. (C) Alignment of Illumina reads on the sequence of clone 2 (one of the clones derived from the cloning of the amplicon shown in B). Two polymorphic sites (boxes) were identified and the frequency (in percentage) of the nucleotides found at those positions are shown. The insets at the bottom show the chromatogram of the sequence determined by the Sanger method in clone 2.

