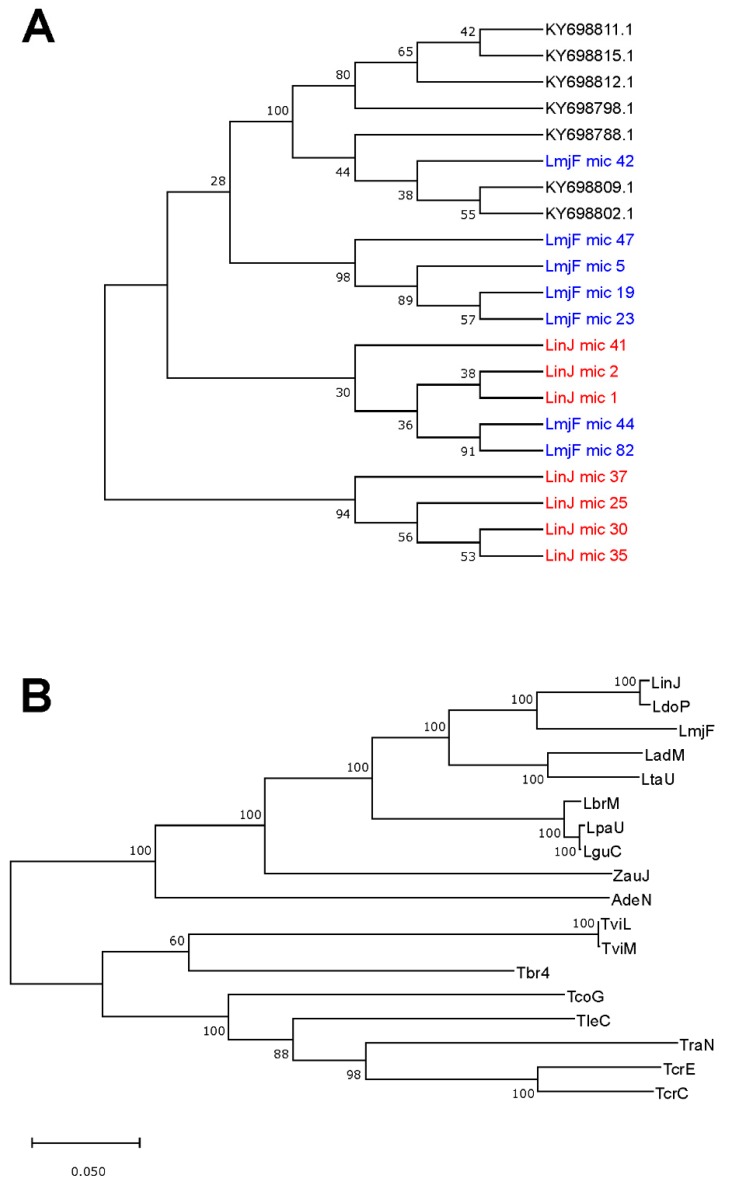
Figure 6.
Analysis of the usefulness of minicircle and maxicircle sequences for phylogenetic purposes. (A) Phylogenetic tree obtained by sequence comparison of seven minicircles randomly selected for each one of the following species: L. major (LmjF mic), L. infantum (LinJ mic) and L. braziliensis (GenBank accession codes). (B) Phylogenetic tree based on the maxicircle sequence of the following trypanosomatids: LinJ, L. infantum (this work); Ldo, L. donovani (GB: CP022652.1); LmjF, L. major (this work); LadM, L. adleri (this work); LtaU, L. tarentolae (GB: M10126.1); LbrM, L. braziliensis (this work); LpaU, L. panamensis (GB: MK570510.1); LguC, L. guyanensis (this work); ZauJ, Zelonia australiensis (GB: MK514117); AdeN, Angomonas deanei (GB: KJ778684.1); TviL (GB: KM386509.1) and TviM (GB: KM386508.1), Trypanosoma vivax; Tbr4 (GB: M94286.1), T. brucei; TcoG (GB: MG948557.1), T. copemani; TleC (GB: KR072974.1), T. lewisi; TraN (GB: KJ803830.1), T. rangeli; TcrE (GB: DQ343646.1) and TcrC (GB: DQ343645.1), T. cruzi. The phylogenetic analyses were carried out as indicated in the legend of Figure 5. The log likelihood of the trees shown in A and B was –16227.07 and –143206.12, respectively. The percentage of trees in which the associated taxa clustered together is shown next to the branches (bootstrap values were obtained from 500 replicates).

