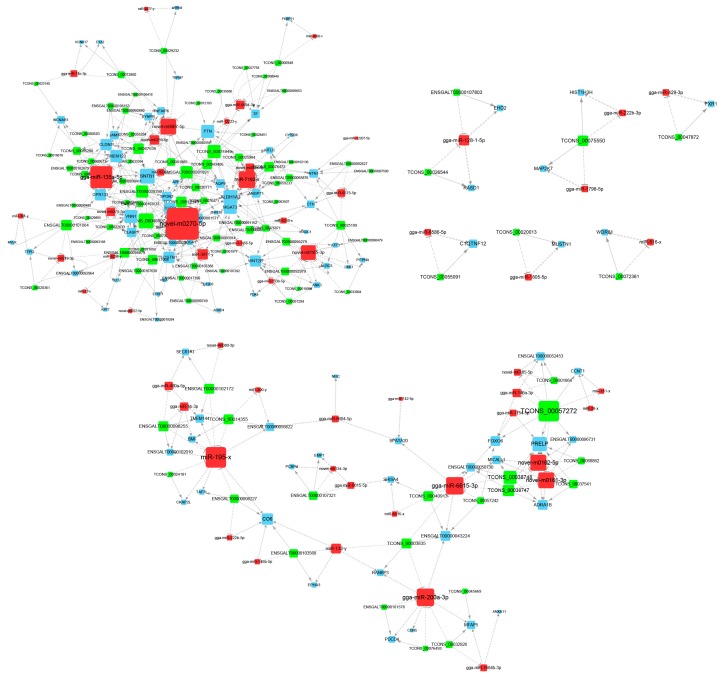
Figure 3.
Visualization of the lncRNA-miRNA-mRNA network. Green nodes indicate lncRNAs, red nodes indicate miRNAs, and blue nodes indicate mRNAs, respectively. Node size is proportional to the connection degree. Connection degree shows the number of connected nodes with the individual node. The higher the degree of a node, the more important the node in the network. Hub genes are the nodes with higher degree i.e., nodes with more connections (degree > 4.9).

