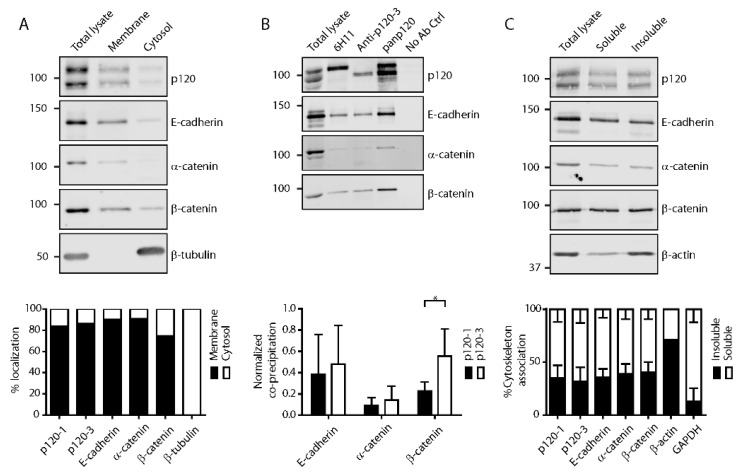
Figure 2.
P120 isoform association with adherens junctions in 4T1 cells. (A) Membrane–cytosol fractionation. (B) Co-immunoprecipitation with isoform-specific antibodies for p120-1 (6H11 mAb) and p120-3 (anti-p120-3 pAb). IP antibodies are indicated above the blots (* p < 0.05). (C) Cytosol extraction. All membranes were incubated with the antibodies indicated adjacent to the blots. In the blots stained for p120, the upper band represents p120-1 and the lower band represents p120-3. Quantifications are shown in bar graphs below the blots.

